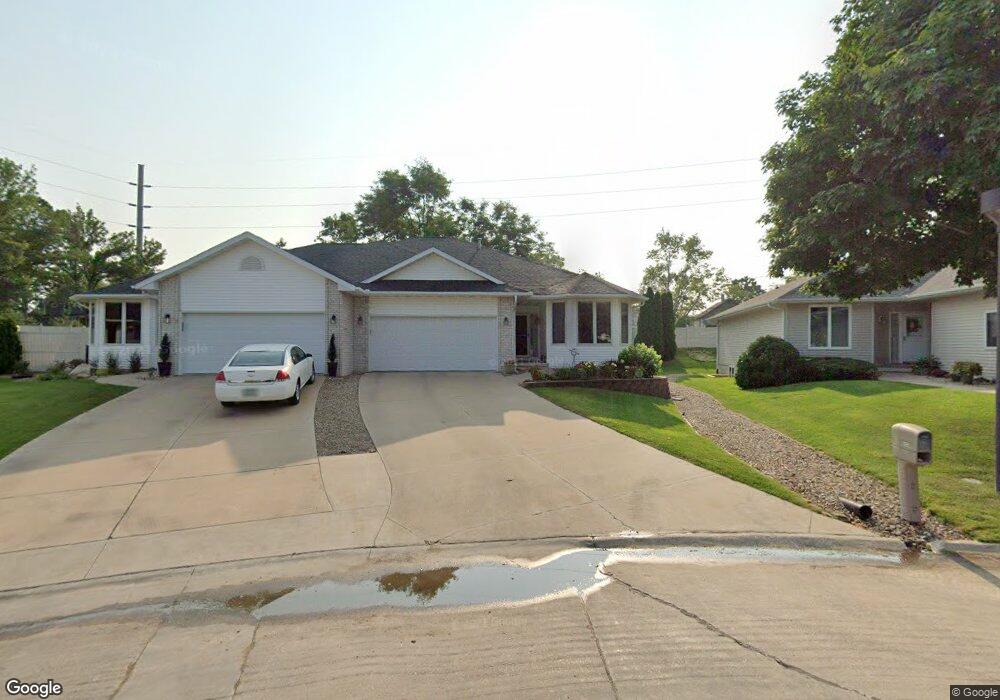
3127 Yorkshire Dr NE Unit 3127 Cedar Rapids, IA 52402
Estimated Value: $178,000 - $289,011
3
Beds
3
Baths
1,570
Sq Ft
$151/Sq Ft
Est. Value
About This Home
This home is located at 3127 Yorkshire Dr NE Unit 3127, Cedar Rapids, IA 52402 and is currently estimated at $237,253, approximately $151 per square foot. 3127 Yorkshire Dr NE Unit 3127 is a home located in Linn County with nearby schools including Arthur Elementary School, Franklin Middle School, and George Washington High School.
Ownership History
Date
Name
Owned For
Owner Type
Purchase Details
Closed on
Feb 22, 2023
Sold by
Dolezal Joan K
Bought by
Rosenkranz Margaret A
Current Estimated Value
Purchase Details
Closed on
Feb 1, 2023
Sold by
Dolezal Steven W and Dolezal Kelsey L
Bought by
Dolezal Joan K
Purchase Details
Closed on
Dec 5, 2022
Sold by
Dolezal Joan K
Bought by
Dolezal Joan K and Dolezal Steven W
Purchase Details
Closed on
Mar 5, 2008
Sold by
Garner Tom R and Garner Lynn A
Bought by
Dolezal Steven M and Dolezal Joan
Home Financials for this Owner
Home Financials are based on the most recent Mortgage that was taken out on this home.
Original Mortgage
$176,000
Interest Rate
5.25%
Mortgage Type
Purchase Money Mortgage
Purchase Details
Closed on
Apr 30, 2007
Sold by
Estes E Goldena
Bought by
Garner Tom R and Garner Lynn A
Create a Home Valuation Report for This Property
The Home Valuation Report is an in-depth analysis detailing your home's value as well as a comparison with similar homes in the area
Home Values in the Area
Average Home Value in this Area
Purchase History
| Date | Buyer | Sale Price | Title Company |
|---|---|---|---|
| Rosenkranz Margaret A | $250,000 | -- | |
| Dolezal Joan K | -- | -- | |
| Dolezal Joan K | -- | None Listed On Document | |
| Dolezal Joan K | -- | -- | |
| Dolezal Steven M | $219,500 | None Available | |
| Garner Tom R | $160,000 | None Available |
Source: Public Records
Mortgage History
| Date | Status | Borrower | Loan Amount |
|---|---|---|---|
| Previous Owner | Dolezal Steven M | $176,000 |
Source: Public Records
Tax History Compared to Growth
Tax History
| Year | Tax Paid | Tax Assessment Tax Assessment Total Assessment is a certain percentage of the fair market value that is determined by local assessors to be the total taxable value of land and additions on the property. | Land | Improvement |
|---|---|---|---|---|
| 2025 | $3,720 | $239,800 | $34,500 | $205,300 |
| 2024 | $4,050 | $234,200 | $28,000 | $206,200 |
| 2023 | $4,050 | $210,200 | $28,000 | $182,200 |
| 2022 | $3,976 | $200,900 | $28,000 | $172,900 |
| 2021 | $4,336 | $200,900 | $28,000 | $172,900 |
| 2020 | $4,336 | $205,100 | $28,000 | $177,100 |
| 2019 | $3,730 | $181,600 | $28,000 | $153,600 |
| 2018 | $3,568 | $181,600 | $28,000 | $153,600 |
| 2017 | $3,568 | $182,700 | $14,000 | $168,700 |
| 2016 | $3,729 | $175,400 | $14,000 | $161,400 |
| 2015 | $4,087 | $192,048 | $14,000 | $178,048 |
| 2014 | $3,902 | $192,048 | $14,000 | $178,048 |
| 2013 | $3,814 | $192,048 | $14,000 | $178,048 |
Source: Public Records
Map
Nearby Homes
- 3123 Yorkshire Dr NE
- 640 Crystal Dr NE
- 636 Crystal Dr NE Unit 636
- 632 Crystal Dr NE
- 628 Crystal Dr NE
- 3117 Yorkshire Dr NE Unit 3117
- 3113 Yorkshire Dr NE Unit 3113
- 3109 Yorkshire Dr NE
- 3105 Yorkshire Dr NE
- 609 32nd St NE
- 3120 E Ave NE
- 3116 E Ave NE
- 3120 East Ave NE
- 3112 E Ave NE
- 639 Crystal Dr NE
- 637 Crystal Dr NE Unit 637
- 633 Crystal Dr NE
- 610 31st St NE
- 3106 E Ave NE
- 3106 Yorkshire Dr NE