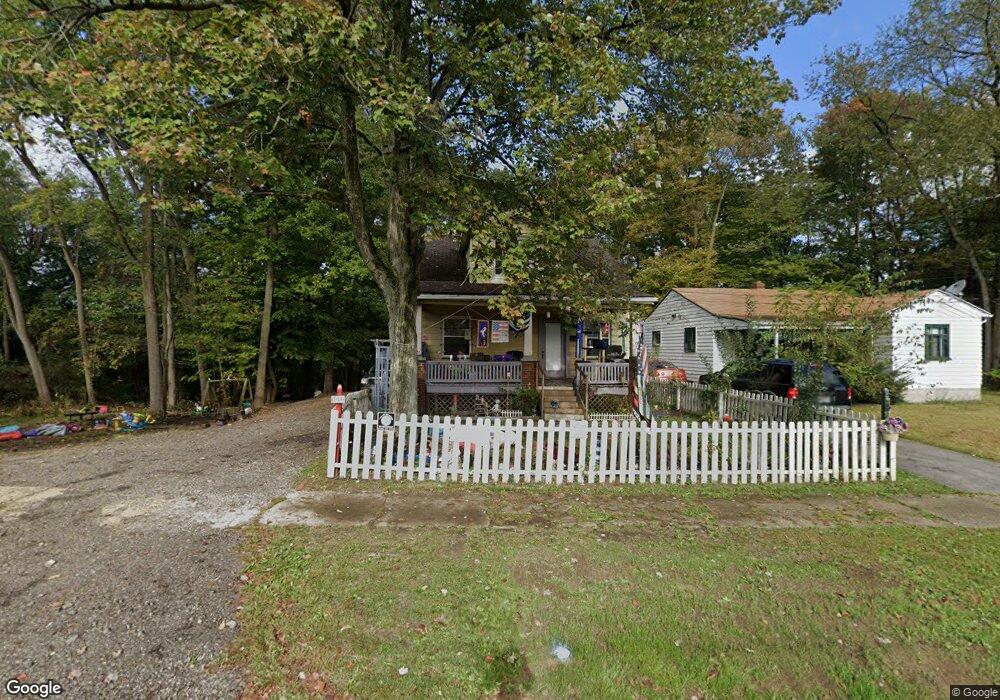
3128 Pine Hollow Dr Youngstown, OH 44502
Buckeye Plat NeighborhoodEstimated Value: $59,298 - $88,000
3
Beds
2
Baths
1,373
Sq Ft
$51/Sq Ft
Est. Value
About This Home
This home is located at 3128 Pine Hollow Dr, Youngstown, OH 44502 and is currently estimated at $70,325, approximately $51 per square foot. 3128 Pine Hollow Dr is a home located in Mahoning County with nearby schools including Paul C. Bunn Elementary School, Chaney High School, and Youngstown Academy of Excellence.
Ownership History
Date
Name
Owned For
Owner Type
Purchase Details
Closed on
May 6, 2020
Sold by
Triune Corporation
Bought by
Triune Twenty One Llc
Current Estimated Value
Purchase Details
Closed on
Jun 24, 2011
Sold by
Fannie Mae
Bought by
Triune Corporation
Purchase Details
Closed on
Nov 1, 2010
Sold by
Cassin Thomas L and Cassin Kelly A
Bought by
Federal National Mortgage Association
Purchase Details
Closed on
Oct 25, 2007
Sold by
Payne Kevin and Payne Jacqueline
Bought by
Cassin Thomas L and Cassin Kelly A
Home Financials for this Owner
Home Financials are based on the most recent Mortgage that was taken out on this home.
Original Mortgage
$34,200
Interest Rate
6.47%
Mortgage Type
Second Mortgage Made To Cover Down Payment
Purchase Details
Closed on
Sep 30, 1998
Sold by
Furr Fred
Bought by
Payne Kevin
Purchase Details
Closed on
Mar 28, 1988
Bought by
Furr Fred
Create a Home Valuation Report for This Property
The Home Valuation Report is an in-depth analysis detailing your home's value as well as a comparison with similar homes in the area
Home Values in the Area
Average Home Value in this Area
Purchase History
| Date | Buyer | Sale Price | Title Company |
|---|---|---|---|
| Triune Twenty One Llc | -- | None Available | |
| Triune Corporation | $9,000 | None Available | |
| Federal National Mortgage Association | $43,830 | None Available | |
| Cassin Thomas L | $38,000 | Commonwealth | |
| Payne Kevin | $30,500 | -- | |
| Furr Fred | -- | -- |
Source: Public Records
Mortgage History
| Date | Status | Borrower | Loan Amount |
|---|---|---|---|
| Previous Owner | Cassin Thomas L | $34,200 |
Source: Public Records
Tax History Compared to Growth
Tax History
| Year | Tax Paid | Tax Assessment Tax Assessment Total Assessment is a certain percentage of the fair market value that is determined by local assessors to be the total taxable value of land and additions on the property. | Land | Improvement |
|---|---|---|---|---|
| 2024 | $402 | $8,180 | $670 | $7,510 |
| 2023 | $399 | $8,180 | $670 | $7,510 |
| 2022 | $361 | $5,690 | $670 | $5,020 |
| 2021 | $361 | $5,690 | $670 | $5,020 |
| 2020 | $363 | $5,690 | $670 | $5,020 |
| 2019 | $370 | $5,170 | $610 | $4,560 |
| 2018 | $373 | $5,170 | $610 | $4,560 |
| 2017 | $370 | $5,170 | $610 | $4,560 |
| 2016 | $376 | $5,650 | $610 | $5,040 |
| 2015 | $368 | $5,650 | $610 | $5,040 |
| 2014 | $366 | $5,650 | $610 | $5,040 |
| 2013 | $361 | $5,650 | $610 | $5,040 |
Source: Public Records
Map
Nearby Homes
- 3222 Sheridan Rd
- 3337 Powers Way
- 3448 Neilson Ave
- 3509 Lenox Ave
- 1313 Humbolt Ave
- 2016 Pointview Ave
- 3551 Shirley Rd
- 939 E Florida Ave
- 941 E Dewey Ave
- 919 E Dewey Ave
- 2007 E Midlothian Blvd
- 1954 Everett Ave
- 884 E Dewey Ave
- 834 Compton Ln
- 0 Weston Ave
- 0 Crescent Dr Unit 5124984
- 808 Marmion Ave
- 805 E Boston Ave
- 1928 Medford Ave
- 2510 E Midlothian Blvd
- 3120 Pine Hollow Dr
- 3144 Pine Hollow Dr
- 3117 Pine Hollow Dr
- 3121 Pine Hollow Dr
- 3143 Pine Hollow Dr
- 3148 Pine Hollow Dr
- 3145 Pine Hollow Dr
- 3112 Powers Way
- 3155 Pine Hollow Dr
- 3218 Sheridan Rd
- 3160 Pine Hollow Dr
- 3161 Pine Hollow Dr
- 3226 Sheridan Rd
- 3230 Sheridan Rd
- 3166 Pine Hollow Dr
- 3122 Powers Way
- 3236 Sheridan Rd
- 3170 Pine Hollow Dr
- 3175 Pine Hollow Dr
- 3208 Powers Way