Estimated Value: $879,000 - $926,980
3
Beds
2
Baths
2,092
Sq Ft
$432/Sq Ft
Est. Value
About This Home
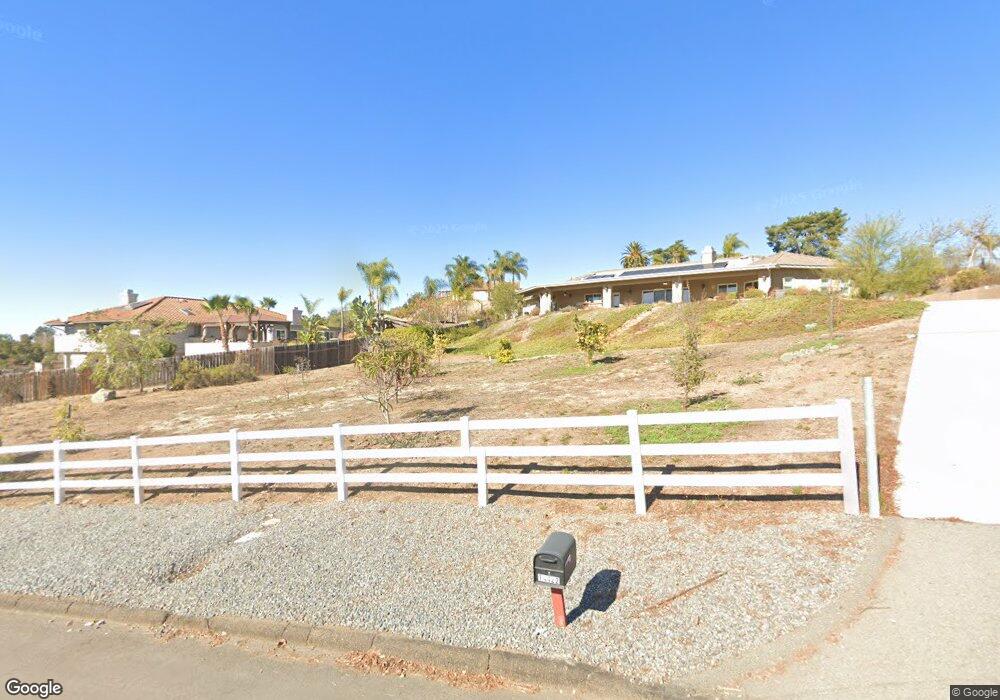
This home is located at 3128 Pleasant View Ln, Jamul, CA 91935 and is currently estimated at $903,995, approximately $432 per square foot. 3128 Pleasant View Ln is a home located in San Diego County with nearby schools including Jamul Primary School, Oak Grove Middle School, and Valhalla High.
Ownership History
Date
Name
Owned For
Owner Type
Purchase Details
Closed on
Aug 20, 2020
Sold by
Back Eugene and Back Susan L
Bought by
Back Eugene and Back Susan
Current Estimated Value
Home Financials for this Owner
Home Financials are based on the most recent Mortgage that was taken out on this home.
Original Mortgage
$302,800
Outstanding Balance
$268,104
Interest Rate
2.9%
Mortgage Type
New Conventional
Estimated Equity
$635,891
Purchase Details
Closed on
Jan 29, 2009
Sold by
Back Eugene and Back Susan
Bought by
Back Eugene and Back Susan
Home Financials for this Owner
Home Financials are based on the most recent Mortgage that was taken out on this home.
Original Mortgage
$376,000
Interest Rate
5.01%
Mortgage Type
Stand Alone Refi Refinance Of Original Loan
Purchase Details
Closed on
Nov 30, 2004
Sold by
Back Eugene and Back Susan
Bought by
Back Eugene and Back Susan
Purchase Details
Closed on
Mar 25, 1986
Purchase Details
Closed on
Oct 13, 1983
Create a Home Valuation Report for This Property
The Home Valuation Report is an in-depth analysis detailing your home's value as well as a comparison with similar homes in the area
Home Values in the Area
Average Home Value in this Area
Purchase History
| Date | Buyer | Sale Price | Title Company |
|---|---|---|---|
| Back Eugene | -- | Accommodation | |
| Back Eugene | -- | Lawyers Title Sd | |
| Back Eugene | -- | Accommodation | |
| Back Eugene | -- | Lawyers Title | |
| Back Eugene | -- | -- | |
| -- | $161,500 | -- | |
| -- | $44,000 | -- |
Source: Public Records
Mortgage History
| Date | Status | Borrower | Loan Amount |
|---|---|---|---|
| Open | Back Eugene | $302,800 | |
| Closed | Back Eugene | $376,000 |
Source: Public Records
Tax History
| Year | Tax Paid | Tax Assessment Tax Assessment Total Assessment is a certain percentage of the fair market value that is determined by local assessors to be the total taxable value of land and additions on the property. | Land | Improvement |
|---|---|---|---|---|
| 2025 | $4,079 | $343,648 | $114,996 | $228,652 |
| 2024 | $4,079 | $336,911 | $112,742 | $224,169 |
| 2023 | $4,003 | $330,306 | $110,532 | $219,774 |
| 2022 | $3,908 | $323,830 | $108,365 | $215,465 |
| 2021 | $3,826 | $317,482 | $106,241 | $211,241 |
| 2020 | $3,806 | $314,227 | $105,152 | $209,075 |
| 2019 | $3,772 | $308,067 | $103,091 | $204,976 |
| 2018 | $3,705 | $302,027 | $101,070 | $200,957 |
| 2017 | $3,630 | $296,106 | $99,089 | $197,017 |
| 2016 | $3,556 | $290,301 | $97,147 | $193,154 |
| 2015 | $3,518 | $285,941 | $95,688 | $190,253 |
| 2014 | $3,381 | $280,341 | $93,814 | $186,527 |
Source: Public Records
Map
Nearby Homes
- 2951-53 Miramontes Rd
- 00 Skyline Truck Trail Unit 1
- 14650 Alkosh Rd
- 0 Jamul Highlands Rd
- 3605 Hidden Trail Dr
- 3126 Reservoir Dr
- 13980 Lyons Valley Rd
- 14404 Hillside Dr
- 4029 Alta Loma Dr
- 00087 Presilla Dr Unit 87
- 15223 Presilla Dr
- 13907 Maxfield Rd
- 14085 Proctor Valley Rd
- 0 Skyline Truck Trail Unit 210014876
- 0 Skyline Truck Trail Unit PTP2509214
- 3696 Alta Loma Dr
- 89 Yacoo Ct Unit 89
- 13749 Calle Del Sol Unit Parcel B
- 15108 Skyline Truck Trail
- 15114 Skyline Truck Trail
- 3251 Ma Lou Dr
- 3158 Pleasant View Ln
- 3273 Ma Lou Dr
- 14422 Kimda Ct
- 3176 Pleasant View Ln
- 3260 Ma Lou Dr
- 14434 Kimda Ct
- 3270 Ma Lou Dr Unit 72
- 3248 Ma Lou Dr
- 3137 Pleasant View Ln
- 3230 Pleasant View Ln
- 14446 Kimda Ct
- 3217 Ma Lou Dr
- 3151 Pleasant View Ln
- 3236 Ma Lou Dr
- 14425 Kimda Ct
- 3216 Loma Vista Dr
- 3209 Pleasant View Ln
- 3215 Loma Vista Dr
- 3225 Loma Vista Dr
Your Personal Tour Guide
Ask me questions while you tour the home.