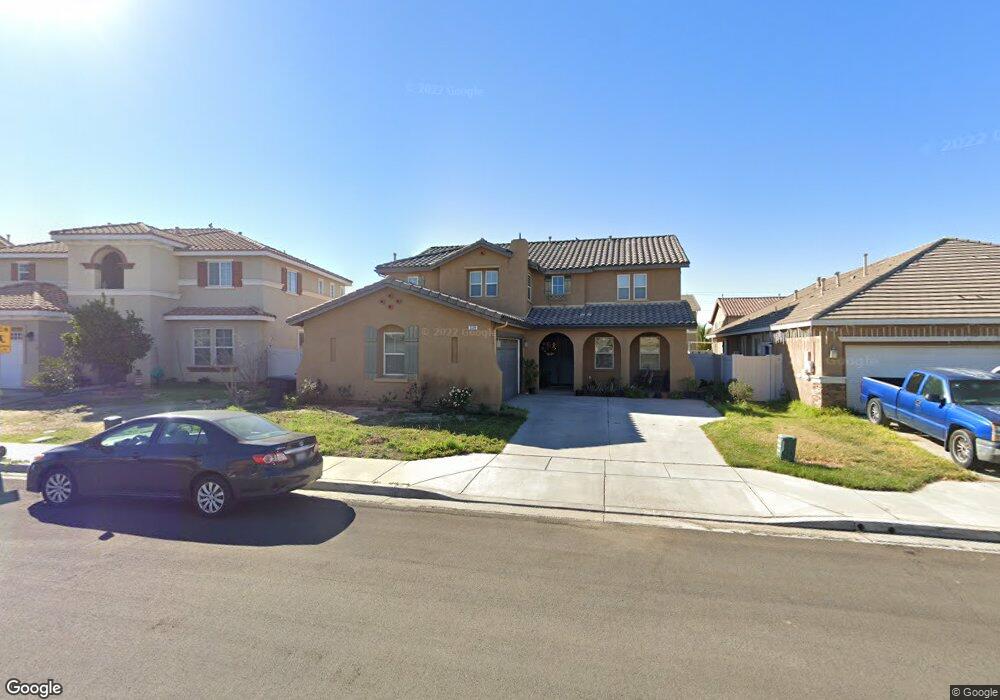
3128 Plover Way Perris, CA 92571
North Perris NeighborhoodEstimated Value: $584,000 - $624,000
3
Beds
3
Baths
3,184
Sq Ft
$187/Sq Ft
Est. Value
About This Home
This home is located at 3128 Plover Way, Perris, CA 92571 and is currently estimated at $595,185, approximately $186 per square foot. 3128 Plover Way is a home located in Riverside County with nearby schools including Sierra Vista Elementary School, Lakeside Middle School, and Rancho Verde High School.
Ownership History
Date
Name
Owned For
Owner Type
Purchase Details
Closed on
Apr 27, 2015
Sold by
Mata Maria Aurora L
Bought by
Manalo Ramon Angelo and Manalo Annalyn
Current Estimated Value
Home Financials for this Owner
Home Financials are based on the most recent Mortgage that was taken out on this home.
Original Mortgage
$245,471
Interest Rate
3.62%
Mortgage Type
FHA
Purchase Details
Closed on
Mar 12, 2013
Sold by
Mata Maria Aurora Lavides
Bought by
Mata Maria Aurora L and Maria Aurora L Mata Revocable Living Tru
Purchase Details
Closed on
Jul 24, 2009
Sold by
De Villa Anna Lyn Austria and De Villa Nino Austria
Bought by
Mata Maria Aurora Lavides
Purchase Details
Closed on
Aug 28, 2006
Sold by
Kb Home Coastal Inc
Bought by
Devilla Annalyn and Deville Nino
Home Financials for this Owner
Home Financials are based on the most recent Mortgage that was taken out on this home.
Original Mortgage
$348,792
Interest Rate
5.62%
Mortgage Type
New Conventional
Create a Home Valuation Report for This Property
The Home Valuation Report is an in-depth analysis detailing your home's value as well as a comparison with similar homes in the area
Home Values in the Area
Average Home Value in this Area
Purchase History
| Date | Buyer | Sale Price | Title Company |
|---|---|---|---|
| Manalo Ramon Angelo | $250,000 | Provident Title | |
| Mata Maria Aurora L | -- | None Available | |
| Mata Maria Aurora Lavides | $185,000 | Security Union Title Ins Co | |
| Devilla Annalyn | $436,000 | First American Title Company |
Source: Public Records
Mortgage History
| Date | Status | Borrower | Loan Amount |
|---|---|---|---|
| Previous Owner | Manalo Ramon Angelo | $245,471 | |
| Previous Owner | Devilla Annalyn | $348,792 |
Source: Public Records
Tax History
| Year | Tax Paid | Tax Assessment Tax Assessment Total Assessment is a certain percentage of the fair market value that is determined by local assessors to be the total taxable value of land and additions on the property. | Land | Improvement |
|---|---|---|---|---|
| 2025 | $7,640 | $300,457 | $60,088 | $240,369 |
| 2023 | $7,640 | $288,791 | $57,755 | $231,036 |
| 2022 | $7,455 | $283,129 | $56,623 | $226,506 |
| 2021 | $7,188 | $277,578 | $55,513 | $222,065 |
| 2020 | $7,143 | $274,732 | $54,944 | $219,788 |
| 2019 | $6,930 | $269,346 | $53,867 | $215,479 |
| 2018 | $6,878 | $264,065 | $52,812 | $211,253 |
| 2017 | $6,865 | $258,888 | $51,777 | $207,111 |
| 2016 | $6,895 | $253,812 | $50,762 | $203,050 |
| 2015 | $6,349 | $198,688 | $32,216 | $166,472 |
| 2014 | $6,260 | $194,798 | $31,586 | $163,212 |
Source: Public Records
Map
Nearby Homes
- 914 Sparrow Way
- 26625 Placentia Ave
- 3236 Mariposa Way
- 20620 Evans Rd
- 26642 Indigo Way
- 26629 Indigo Way
- 26669 Indigo Way
- 450 Lisbon St
- 0 NW Corner of Ramona Expressway & Rider St Unit IV25235052
- 3608 Charolais Place
- 3039 Bearberry Ct
- 3080 Kalei Ct
- 3107 Lake View Dr
- 716 Periwinkle Ln
- 1391 Ranch St
- 3714 Avondale St
- 3705 Solandra St
- 26490 Orange Ave
- 1216 Lilac Ridge Dr
- 2536 Slew of Gold Ct
- 3120 Plover Way
- 3136 Plover Way
- 3133 Clapper St
- 3125 Clapper St
- 3112 Plover Way
- 3141 Clapper St
- 3119 Clapper St
- 3127 Plover Way
- 3135 Plover Way
- 3109 Clapper St
- 3104 Plover Way
- 3119 Plover Way
- 860 Parula St
- 868 Parula St
- 852 Parula St
- 3101 Clapper St
- 876 Parula St
- 3111 Plover Way
- 3096 Plover Way
- 844 Parula St
Your Personal Tour Guide
Ask me questions while you tour the home.