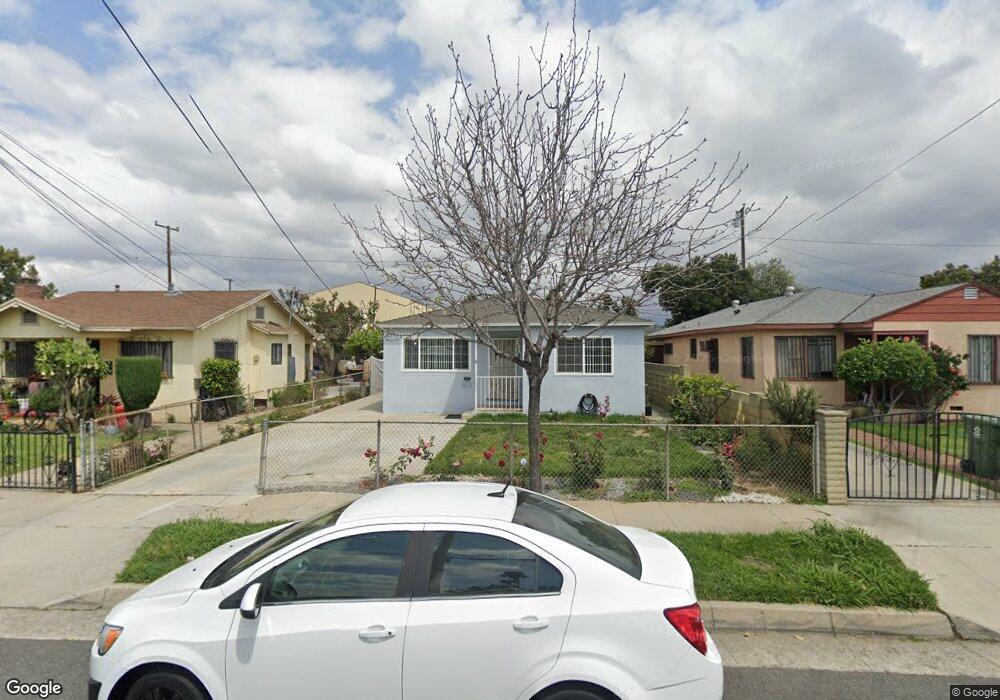
3129 Front St Alhambra, CA 91803
Alhambra Hills NeighborhoodEstimated Value: $709,170 - $870,000
2
Beds
1
Bath
872
Sq Ft
$891/Sq Ft
Est. Value
About This Home
This home is located at 3129 Front St, Alhambra, CA 91803 and is currently estimated at $777,293, approximately $891 per square foot. 3129 Front St is a home located in Los Angeles County with nearby schools including Fremont Elementary School, Alhambra High School, and St. Thomas More Catholic Elementary School.
Ownership History
Date
Name
Owned For
Owner Type
Purchase Details
Closed on
Mar 28, 2002
Sold by
Lopez Jose Ruben
Bought by
Hernandez Herman Cruz and Cruz Enedina A
Current Estimated Value
Purchase Details
Closed on
Jun 23, 2000
Sold by
Battaglia Sebastian Anthony
Bought by
Lopez Jose Ruben
Home Financials for this Owner
Home Financials are based on the most recent Mortgage that was taken out on this home.
Original Mortgage
$133,950
Interest Rate
7.15%
Purchase Details
Closed on
Jul 11, 1997
Sold by
Salo Roselee
Bought by
Battaglia Sebastian Anthony
Purchase Details
Closed on
May 12, 1997
Sold by
Salo Roselee
Bought by
Salo Roselle
Purchase Details
Closed on
Feb 21, 1997
Sold by
Agnello Richard J
Bought by
Battaglia Sebastian Anthony
Create a Home Valuation Report for This Property
The Home Valuation Report is an in-depth analysis detailing your home's value as well as a comparison with similar homes in the area
Home Values in the Area
Average Home Value in this Area
Purchase History
| Date | Buyer | Sale Price | Title Company |
|---|---|---|---|
| Hernandez Herman Cruz | -- | -- | |
| Lopez Jose Ruben | $141,000 | Old Republic Title Company | |
| Battaglia Sebastian Anthony | -- | -- | |
| Salo Roselle | -- | -- | |
| Battaglia Sebastian Anthony | -- | -- |
Source: Public Records
Mortgage History
| Date | Status | Borrower | Loan Amount |
|---|---|---|---|
| Previous Owner | Lopez Jose Ruben | $133,950 |
Source: Public Records
Tax History
| Year | Tax Paid | Tax Assessment Tax Assessment Total Assessment is a certain percentage of the fair market value that is determined by local assessors to be the total taxable value of land and additions on the property. | Land | Improvement |
|---|---|---|---|---|
| 2025 | $3,739 | $295,439 | $218,630 | $76,809 |
| 2024 | $3,739 | $289,647 | $214,344 | $75,303 |
| 2023 | $3,726 | $283,969 | $210,142 | $73,827 |
| 2022 | $3,555 | $278,402 | $206,022 | $72,380 |
| 2021 | $3,516 | $272,944 | $201,983 | $70,961 |
| 2019 | $3,396 | $264,850 | $195,993 | $68,857 |
| 2018 | $3,359 | $259,657 | $192,150 | $67,507 |
| 2016 | $3,094 | $249,577 | $184,690 | $64,887 |
| 2015 | $3,047 | $245,829 | $181,916 | $63,913 |
| 2014 | $3,012 | $241,015 | $178,353 | $62,662 |
Source: Public Records
Map
Nearby Homes
- 2909 Front St
- 2901 Front St
- 2334 Highbury Ave
- 2345 Highbury Ave Unit 22
- 5349 Allan St
- 1652 La Golondrina Ave
- 2324 Lillyvale Ave Unit 143
- 1705 S Fremont Ave
- 5436 Norwich Ave
- 2917 W Hellman Ave
- 2323 Warwick Ave
- 1343 Edgewood Dr
- 1425 Edgewood Dr
- 5371 Alhambra Ave
- 1342 Edgewood Dr
- 2916 Vaquero Ave
- 5360 Ithaca Ave
- 5306 Borland Rd
- 1300 S Date Ave
- 2204 Orange Grove Ave
Your Personal Tour Guide
Ask me questions while you tour the home.