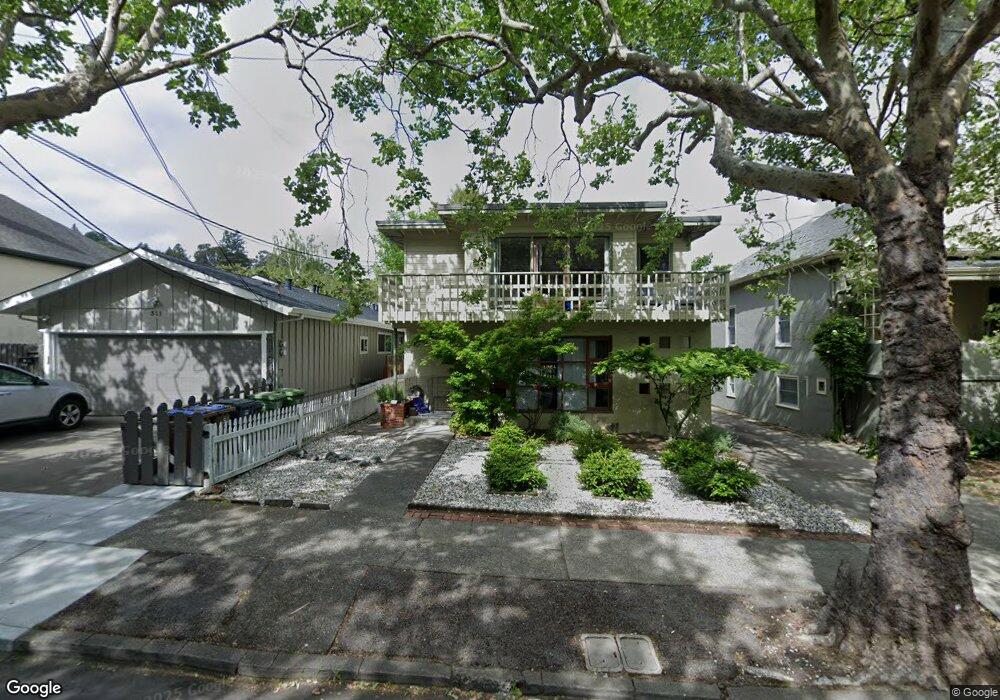
313 C St San Rafael, CA 94901
Gerstle Park NeighborhoodEstimated Value: $1,182,000 - $1,353,000
--
Bed
3
Baths
2,218
Sq Ft
$571/Sq Ft
Est. Value
About This Home
This home is located at 313 C St, San Rafael, CA 94901 and is currently estimated at $1,267,164, approximately $571 per square foot. 313 C St is a home located in Marin County with nearby schools including Laurel Dell Elementary School, James B. Davidson Middle School, and San Rafael High School.
Ownership History
Date
Name
Owned For
Owner Type
Purchase Details
Closed on
Jun 17, 2003
Sold by
Simonton Jack Witherington
Bought by
Reinhard Tania
Current Estimated Value
Home Financials for this Owner
Home Financials are based on the most recent Mortgage that was taken out on this home.
Original Mortgage
$463,200
Outstanding Balance
$204,228
Interest Rate
5.87%
Mortgage Type
Purchase Money Mortgage
Estimated Equity
$1,062,936
Create a Home Valuation Report for This Property
The Home Valuation Report is an in-depth analysis detailing your home's value as well as a comparison with similar homes in the area
Home Values in the Area
Average Home Value in this Area
Purchase History
| Date | Buyer | Sale Price | Title Company |
|---|---|---|---|
| Reinhard Tania | $579,000 | First Amer Title Co Of Marin |
Source: Public Records
Mortgage History
| Date | Status | Borrower | Loan Amount |
|---|---|---|---|
| Open | Reinhard Tania | $463,200 |
Source: Public Records
Tax History Compared to Growth
Tax History
| Year | Tax Paid | Tax Assessment Tax Assessment Total Assessment is a certain percentage of the fair market value that is determined by local assessors to be the total taxable value of land and additions on the property. | Land | Improvement |
|---|---|---|---|---|
| 2025 | $12,118 | $749,449 | $376,797 | $372,652 |
| 2024 | $12,118 | $734,758 | $369,411 | $365,347 |
| 2023 | $11,803 | $720,354 | $362,169 | $358,185 |
| 2022 | $11,230 | $706,230 | $355,068 | $351,162 |
| 2021 | $11,062 | $692,386 | $348,108 | $344,278 |
| 2020 | $10,949 | $685,292 | $344,541 | $340,751 |
| 2019 | $10,529 | $671,860 | $337,788 | $334,072 |
| 2018 | $10,433 | $658,691 | $331,167 | $327,524 |
| 2017 | $10,080 | $645,778 | $324,675 | $321,103 |
| 2016 | $9,747 | $633,116 | $318,309 | $314,807 |
| 2015 | $9,321 | $623,611 | $313,530 | $310,081 |
| 2014 | $8,902 | $611,396 | $307,389 | $304,007 |
Source: Public Records
Map
Nearby Homes