
Landlord's Agent in 2025
Jason Pittman
Ammons Pittman Property Manage
(919) 790-5455
1 in this area
45 Total Sales
Estimated Value: $1,163,000 - $1,248,000
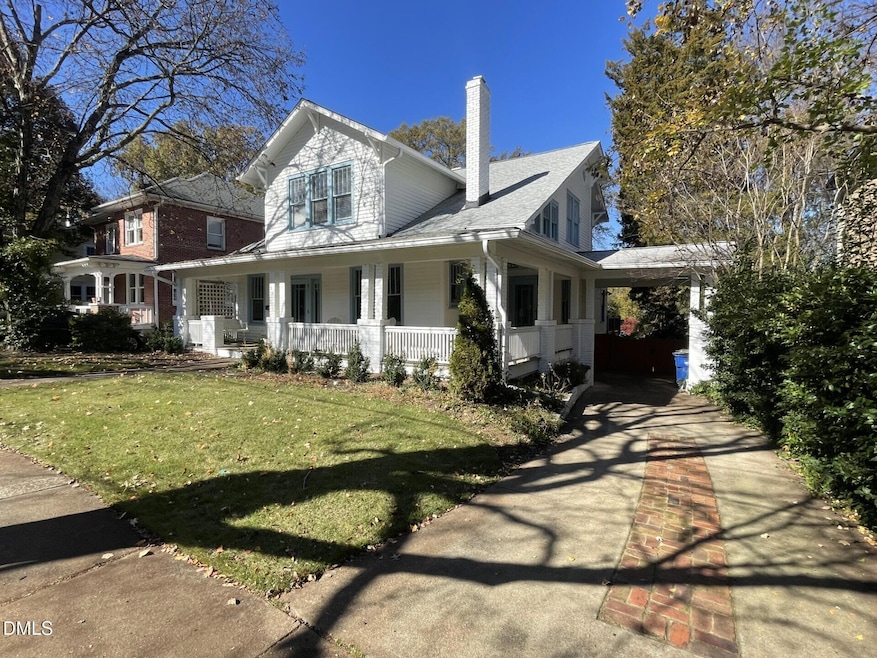
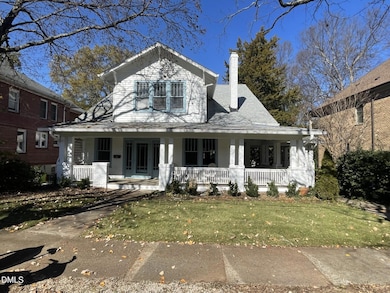
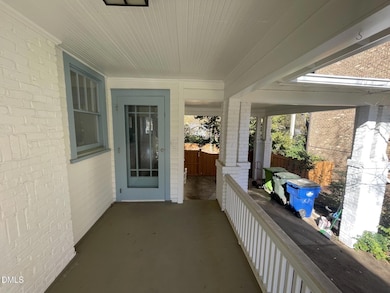
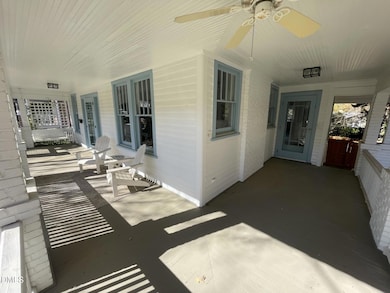
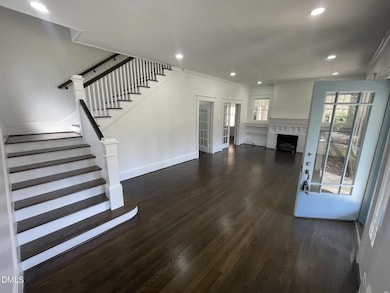
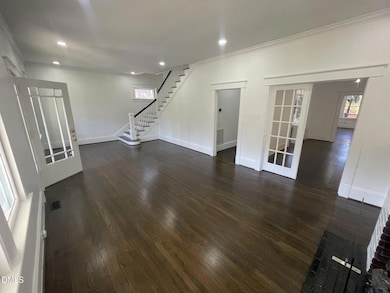
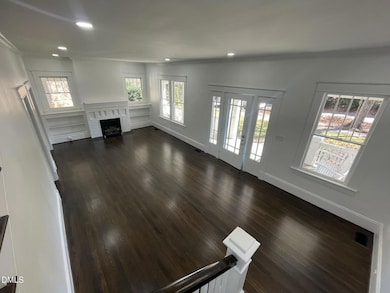
Very updated Hundered and ten year old House in Cameron Park! 4 Bedroom 3.5 Bath with Wraparound front porch! Tall ceilings with the hardwood wood floors, Hard surface countertops and tile showers. Old home with modern fixtures! Must See this Beautiful House!
Last Agent to Rent the Property
Ammons Pittman Property Manage License #281498 Listed on: 11/12/2025
Last Renter's Agent
Ammons Pittman Property Manage License #281498 Listed on: 11/12/2025
| Date | Buyer | Sale Price | Title Company |
|---|---|---|---|
| Blue Ram Mountain Llc | $1,170,000 | None Listed On Document | |
| Parris Edmund Spencer | -- | None Listed On Document | |
| Parris Edmund Spencer | $850,000 | None Available | |
| Parris Edmund Spencer | $850,000 | None Listed On Document | |
| Mclester Ralph J | $410,000 | -- |
| Date | Status | Borrower | Loan Amount |
|---|---|---|---|
| Open | Blue Ram Mountain Llc | $848,786 | |
| Previous Owner | Parris Edmund Spencer | $637,500 |
| Date | Event | Price | List to Sale | Price per Sq Ft |
|---|---|---|---|---|
| 12/08/2025 12/08/25 | Rented | $4,400 | 0.0% | -- |
| 11/12/2025 11/12/25 | For Rent | $4,400 | -- | -- |
| Year | Tax Paid | Tax Assessment Tax Assessment Total Assessment is a certain percentage of the fair market value that is determined by local assessors to be the total taxable value of land and additions on the property. | Land | Improvement |
|---|---|---|---|---|
| 2025 | $9,049 | $1,035,315 | $525,000 | $510,315 |
| 2024 | $9,012 | $1,035,315 | $525,000 | $510,315 |
| 2023 | $8,603 | $787,465 | $400,000 | $387,465 |
| 2022 | $7,993 | $787,465 | $400,000 | $387,465 |
| 2021 | $7,682 | $787,465 | $400,000 | $387,465 |
| 2020 | $7,542 | $787,465 | $400,000 | $387,465 |
| 2019 | $6,807 | $585,612 | $240,000 | $345,612 |
| 2018 | $6,418 | $585,612 | $240,000 | $345,612 |
| 2017 | $6,112 | $560,011 | $240,000 | $320,011 |
| 2016 | $5,725 | $560,011 | $240,000 | $320,011 |
| 2015 | $6,357 | $611,959 | $295,800 | $316,159 |
| 2014 | -- | $607,510 | $295,800 | $311,710 |
Landlord's Agent in 2025
Jason Pittman
Ammons Pittman Property Manage
(919) 790-5455
1 in this area
45 Total Sales
Source: Doorify MLS
MLS Number: 10132581
APN: 1704.18-20-9853-000
Disclaimer: Certain information contained herein is derived from information provided by parties other than Homes.com. All information provided is deemed reliable, but is not guaranteed to be accurate and should be independently verified.
![]() Some IDX listings have been excluded from this IDX display. Brokers make an effort to deliver accurate information, but buyers should independently verify any information on which they will rely in a transaction. The listing broker shall not be responsible for any typographical errors, misinformation, or misprints, and they shall be held totally harmless from any damages arising from reliance upon this data. This data is provided exclusively for consumers’ personal, non-commercial use. Listings marked with an icon are provided courtesy of the Doorify MLS, Inc. of North Carolina, Internet Data Exchange Database. Closed (sold) listings may have been listed and/or sold by a real estate firm other than the firm(s) featured on this website. Closed data is not available until the sale of the property is recorded in the MLS. Home sale data is not an appraisal, CMA, competitive or comparative market analysis, or home valuation of any property. Copyright 2026 Doorify MLS, Inc. of North Carolina. All rights reserved.
Some IDX listings have been excluded from this IDX display. Brokers make an effort to deliver accurate information, but buyers should independently verify any information on which they will rely in a transaction. The listing broker shall not be responsible for any typographical errors, misinformation, or misprints, and they shall be held totally harmless from any damages arising from reliance upon this data. This data is provided exclusively for consumers’ personal, non-commercial use. Listings marked with an icon are provided courtesy of the Doorify MLS, Inc. of North Carolina, Internet Data Exchange Database. Closed (sold) listings may have been listed and/or sold by a real estate firm other than the firm(s) featured on this website. Closed data is not available until the sale of the property is recorded in the MLS. Home sale data is not an appraisal, CMA, competitive or comparative market analysis, or home valuation of any property. Copyright 2026 Doorify MLS, Inc. of North Carolina. All rights reserved.
Ask me questions while you tour the home.