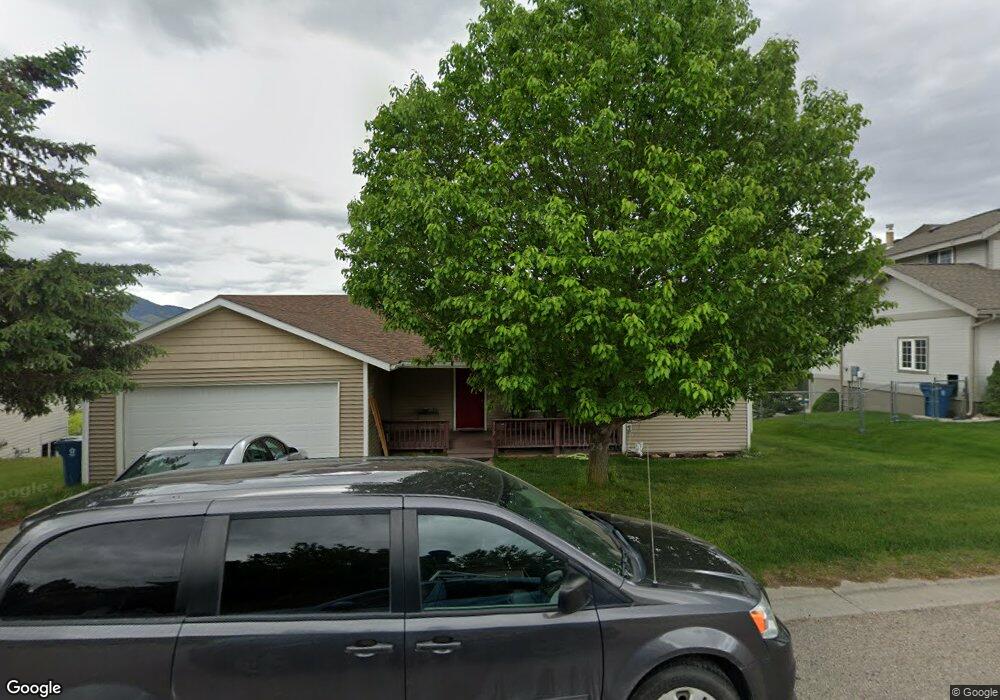
313 Capdevilla Lolo, MT 59847
Lolo NeighborhoodEstimated Value: $431,000 - $524,775
4
Beds
3
Baths
1,276
Sq Ft
$379/Sq Ft
Est. Value
About This Home
This home is located at 313 Capdevilla, Lolo, MT 59847 and is currently estimated at $484,194, approximately $379 per square foot. 313 Capdevilla is a home located in Missoula County with nearby schools including Lolo Elementary School, Lolo Middle School, and Sentinel High School.
Ownership History
Date
Name
Owned For
Owner Type
Purchase Details
Closed on
Sep 16, 2024
Sold by
Klette Crystal M and Holden Christopher M
Bought by
Castillo Leonardo and Hollis Mayra
Current Estimated Value
Home Financials for this Owner
Home Financials are based on the most recent Mortgage that was taken out on this home.
Original Mortgage
$364,000
Outstanding Balance
$359,924
Interest Rate
6.49%
Mortgage Type
New Conventional
Estimated Equity
$124,270
Purchase Details
Closed on
Oct 31, 2017
Sold by
Nisebet Dennis P and Nisebet Robin L
Bought by
Klette Crystal M and Holden Christopher M
Home Financials for this Owner
Home Financials are based on the most recent Mortgage that was taken out on this home.
Original Mortgage
$270,424
Interest Rate
3.83%
Mortgage Type
VA
Purchase Details
Closed on
Nov 1, 2010
Sold by
Nisbet Dennis P
Bought by
Nisbet Dennis P and Nisbet Robin L
Home Financials for this Owner
Home Financials are based on the most recent Mortgage that was taken out on this home.
Original Mortgage
$70,000
Interest Rate
4.33%
Mortgage Type
New Conventional
Create a Home Valuation Report for This Property
The Home Valuation Report is an in-depth analysis detailing your home's value as well as a comparison with similar homes in the area
Home Values in the Area
Average Home Value in this Area
Purchase History
| Date | Buyer | Sale Price | Title Company |
|---|---|---|---|
| Castillo Leonardo | -- | Insured Title | |
| Klette Crystal M | -- | None Available | |
| Nisbet Dennis P | -- | Mt |
Source: Public Records
Mortgage History
| Date | Status | Borrower | Loan Amount |
|---|---|---|---|
| Open | Castillo Leonardo | $364,000 | |
| Previous Owner | Klette Crystal M | $270,424 | |
| Previous Owner | Nisbet Dennis P | $70,000 |
Source: Public Records
Tax History
| Year | Tax Paid | Tax Assessment Tax Assessment Total Assessment is a certain percentage of the fair market value that is determined by local assessors to be the total taxable value of land and additions on the property. | Land | Improvement |
|---|---|---|---|---|
| 2025 | $4,680 | $436,708 | $121,268 | $315,440 |
| 2024 | $4,889 | $422,500 | $94,445 | $328,055 |
| 2023 | $4,647 | $422,500 | $94,445 | $328,055 |
| 2022 | $3,934 | $293,300 | $0 | $0 |
| 2021 | $3,095 | $293,300 | $0 | $0 |
| 2020 | $3,442 | $271,200 | $0 | $0 |
| 2019 | $3,423 | $271,200 | $0 | $0 |
| 2018 | $3,078 | $244,200 | $0 | $0 |
| 2017 | $2,475 | $244,200 | $0 | $0 |
| 2016 | $2,736 | $207,900 | $0 | $0 |
| 2015 | $2,608 | $207,900 | $0 | $0 |
| 2014 | $2,669 | $119,939 | $0 | $0 |
Source: Public Records
Map
Nearby Homes
- 261 Capdevilla
- 117 Tyler Way
- 11305 Napton Way
- 6202 Brewery Way
- 6896 Jack Pine Ct
- 10487 Coulter Pine St
- 10613 Coulter Pine St
- 10291 Coulter Pine St
- 5608 Golf Dr
- 5306 Avalon Ln
- 5692 Lonesome Dove Ln
- 5702 Lonesome Dove Ln
- 5125 Avalon Ln
- 12819 Anchor Rd
- NHN Hughes Ct
- 11385 Trillium Ln
- 10840 Red Fox Ct
- 6160 Delarka Dr
- 0 U S 93 Unit Lot 4 30025598
- 0 U S 93 Unit Lot 1 30025579
- 313 Cap de Villa
- 309 Capdevilla
- 317 Capdevilla
- 309 Cap de Villa
- 318 Capdevilla
- 321 Capdevilla
- 305 Capdevilla
- 304 Capdevilla
- 322 Capdevilla
- 325 Capdevilla
- 301 Capdevilla
- 330 Capdevilla
- 269 Essex St
- 329 Capdevilla
- 288 Capdevilla
- 275 Essex St
- 293 Cap de Villa
- 333 Capdevilla
- 293 Capdevilla
- 340 Capdevilla
Your Personal Tour Guide
Ask me questions while you tour the home.