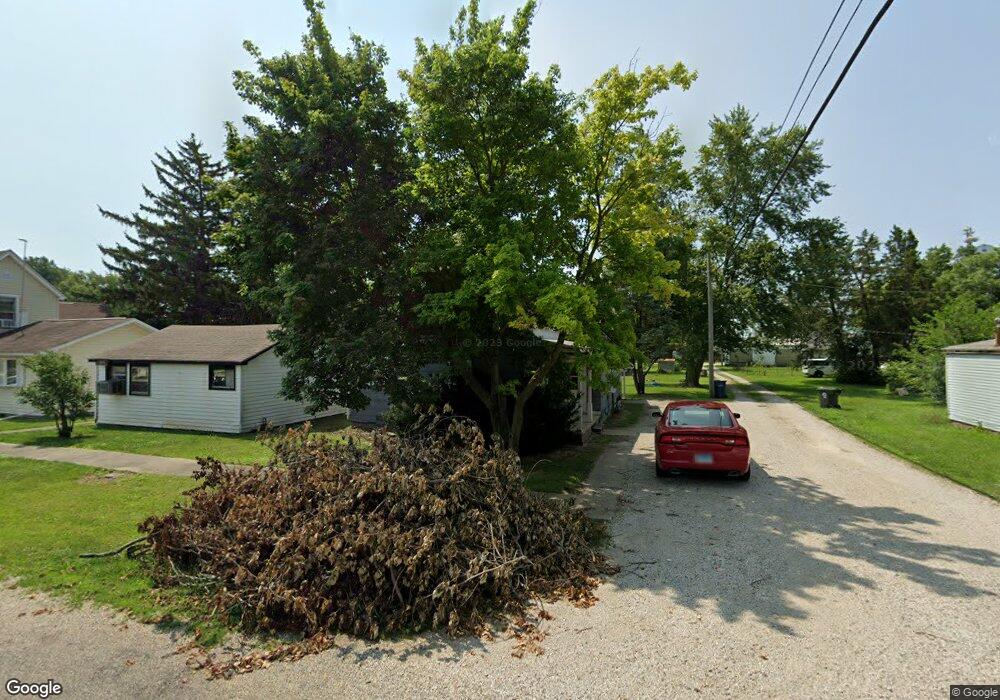
313 E Jackson Ave Chrisman, IL 61924
Estimated Value: $37,000 - $96,000
Studio
--
Bath
--
Sq Ft
7,492
Sq Ft Lot
About This Home
This home is located at 313 E Jackson Ave, Chrisman, IL 61924 and is currently estimated at $59,791. 313 E Jackson Ave is a home located in Edgar County with nearby schools including Chrisman Elementary School, Chrisman-Scottland Junior High School, and Chrisman High School.
Ownership History
Date
Name
Owned For
Owner Type
Purchase Details
Closed on
Apr 26, 2010
Bought by
Sublett Nathan K and Jackson St 313 E
Current Estimated Value
Create a Home Valuation Report for This Property
The Home Valuation Report is an in-depth analysis detailing your home's value as well as a comparison with similar homes in the area
Purchase History
| Date | Buyer | Sale Price | Title Company |
|---|---|---|---|
| Sublett Nathan K | $5,500 | -- |
Source: Public Records
Tax History
| Year | Tax Paid | Tax Assessment Tax Assessment Total Assessment is a certain percentage of the fair market value that is determined by local assessors to be the total taxable value of land and additions on the property. | Land | Improvement |
|---|---|---|---|---|
| 2024 | $478 | $7,190 | $1,060 | $6,130 |
| 2023 | $478 | $6,780 | $1,000 | $5,780 |
| 2022 | $0 | $6,710 | $1,000 | $5,710 |
| 2021 | $0 | $6,710 | $1,000 | $5,710 |
| 2020 | $0 | $6,710 | $1,000 | $5,710 |
| 2019 | $0 | $6,710 | $1,000 | $5,710 |
| 2018 | $0 | $6,790 | $1,000 | $5,790 |
| 2017 | -- | $6,790 | $1,000 | $5,790 |
| 2016 | -- | $6,790 | $1,000 | $5,790 |
| 2015 | -- | $6,790 | $1,000 | $5,790 |
| 2013 | -- | $6,520 | $980 | $5,540 |
Source: Public Records
Map
Nearby Homes
- 221 S Ohio St
- 215 E Monroe Ave
- 613 E Monroe Ave
- 722 E Madison Ave
- 715 E Jefferson Ave
- 2 Quail Ct
- 1 S 3rd St
- 14 E Owen St
- 104 W North St
- 22715 E 2650th Rd
- 2371 N 1860 East Rd
- 101 S Vermilion St
- 0 S State Road 71
- 148 N Maple St
- 260 N Maple St
- 11400 N 1150 E
- 1500 College Ave
- 402 N Willow St
- 11072 Indiana 71
- 3218 W North St
- 321 E Jackson Ave
- 309 E Jackson Ave
- 214 S Pennsylvania St
- 209 S Ohio St
- 121 S Ohio St
- 120 S Pennsylvania St
- 215 S Ohio St
- 224 S Pennsylvania St
- 113 S Ohio St
- 223 E Jackson Ave
- 223 S Pennsylvania St
- 0 Illinois 1
- 219 E Jackson Ave
- 120 S Ohio St
- 315 E Monroe Ave
- 111 S Ohio St
- 222 E Lincoln Ave
- 409 E Jackson Ave
- 311 E Monroe Ave
- 213 E Jackson Ave
Your Personal Tour Guide
Ask me questions while you tour the home.