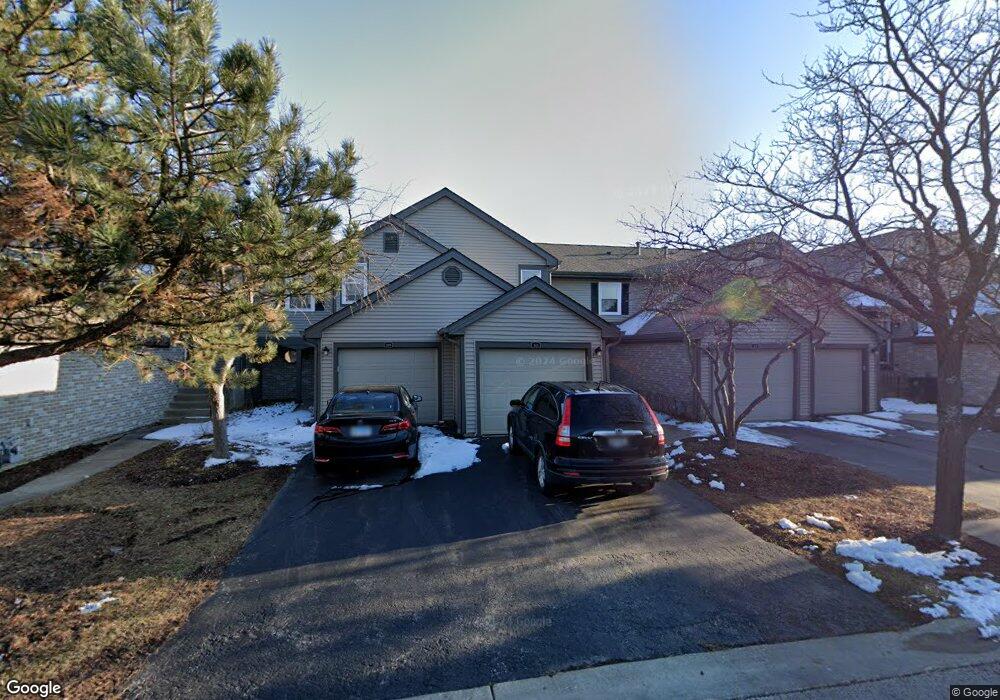
313 Grissom Ct Unit 6SD4 Hoffman Estates, IL 60169
South Hoffman Estates NeighborhoodEstimated Value: $281,000 - $309,849
2
Beds
3
Baths
1,250
Sq Ft
$237/Sq Ft
Est. Value
About This Home
This home is located at 313 Grissom Ct Unit 6SD4, Hoffman Estates, IL 60169 and is currently estimated at $295,962, approximately $236 per square foot. 313 Grissom Ct Unit 6SD4 is a home located in Cook County with nearby schools including Lakeview Elementary School, Helen Keller Junior High School, and J B Conant High School.
Ownership History
Date
Name
Owned For
Owner Type
Purchase Details
Closed on
Oct 14, 2004
Sold by
Bradburn Anthony and Bradburn Frances
Bought by
Lai Bryan
Current Estimated Value
Home Financials for this Owner
Home Financials are based on the most recent Mortgage that was taken out on this home.
Original Mortgage
$138,750
Outstanding Balance
$67,632
Interest Rate
5.85%
Mortgage Type
Stand Alone First
Estimated Equity
$228,330
Purchase Details
Closed on
Oct 25, 2001
Sold by
Dequaker Lori A
Bought by
Bradburn Anthony
Home Financials for this Owner
Home Financials are based on the most recent Mortgage that was taken out on this home.
Original Mortgage
$133,650
Interest Rate
6.64%
Purchase Details
Closed on
Sep 18, 1995
Sold by
Smith Chet M and Smith Charlene A
Bought by
Smith Chet M and Smith Charlene A
Create a Home Valuation Report for This Property
The Home Valuation Report is an in-depth analysis detailing your home's value as well as a comparison with similar homes in the area
Home Values in the Area
Average Home Value in this Area
Purchase History
| Date | Buyer | Sale Price | Title Company |
|---|---|---|---|
| Lai Bryan | $185,000 | Law Title | |
| Bradburn Anthony | $148,500 | Chicago Title Insurance Co | |
| Smith Chet M | -- | -- |
Source: Public Records
Mortgage History
| Date | Status | Borrower | Loan Amount |
|---|---|---|---|
| Open | Lai Bryan | $138,750 | |
| Previous Owner | Bradburn Anthony | $133,650 | |
| Closed | Lai Bryan | $27,750 |
Source: Public Records
Tax History
| Year | Tax Paid | Tax Assessment Tax Assessment Total Assessment is a certain percentage of the fair market value that is determined by local assessors to be the total taxable value of land and additions on the property. | Land | Improvement |
|---|---|---|---|---|
| 2025 | $5,210 | $28,035 | $3,671 | $24,364 |
| 2024 | $5,210 | $20,294 | $3,059 | $17,235 |
| 2023 | $5,011 | $20,294 | $3,059 | $17,235 |
| 2022 | $5,011 | $20,294 | $3,059 | $17,235 |
| 2021 | $4,225 | $15,942 | $3,670 | $12,272 |
| 2020 | $4,201 | $15,942 | $3,670 | $12,272 |
| 2019 | $4,256 | $17,967 | $3,670 | $14,297 |
| 2018 | $3,557 | $14,344 | $3,058 | $11,286 |
| 2017 | $3,513 | $14,344 | $3,058 | $11,286 |
| 2016 | $3,529 | $14,344 | $3,058 | $11,286 |
| 2015 | $3,062 | $12,158 | $2,676 | $9,482 |
| 2014 | $3,026 | $12,158 | $2,676 | $9,482 |
| 2013 | $2,930 | $12,158 | $2,676 | $9,482 |
Source: Public Records
Map
Nearby Homes
- 368 Willow Tree Ct
- 800 Linden Cir
- 100 Des Plaines Ln
- 630 Bode Rd
- 600 Mesa Dr Unit 104
- 600 Mesa Dr Unit 103
- 615 Hill Dr Unit 303
- 555 Heritage Dr Unit 315
- 480 Illinois Blvd
- 670 Lakeview Ln
- 1180 Meadow Ln Unit 108
- 1025 Higgins Quarters Dr Unit 4-109
- 200 W Thacker St
- 720 Hill Dr Unit 8303
- 740 Hill Dr Unit 303
- 730 Hill Dr Unit 9205
- 1085 Higgins Quarters Dr Unit 104
- 313 Lincoln St
- 540 Newark Ln
- 755 Cambridge Ln
- 309 Grissom Ct Unit 6SE3
- 317 Grissom Ct Unit 6SC5
- 305 Grissom Ct Unit 6SB2
- 321 Grissom Ct Unit 6SE6
- 325 Grissom Ct Unit 6SB8
- 301 Grissom Ct Unit 6SA1
- 329 Grissom Ct Unit 6SA7
- 316 Grissom Ct Unit 1SD4
- 304 Grissom Ct Unit 1SB8L
- 333 Grissom Ct Unit 5SA1
- 324 Grissom Ct Unit 1SB2
- 308 Grissom Ct Unit 1SD6
- 312 Grissom Ct Unit 1SC5
- 320 Grissom Ct Unit 1SE3
- 365 Grissom Ln Unit 365
- 300 Grissom Ct Unit 1SA7
- 328 Grissom Ct Unit 1SA1
- 345 Grissom Ct Unit 5SC4
- 337 Grissom Ct Unit 5SB2
- 336 Grissom Ct Unit 2SB8L
Your Personal Tour Guide
Ask me questions while you tour the home.