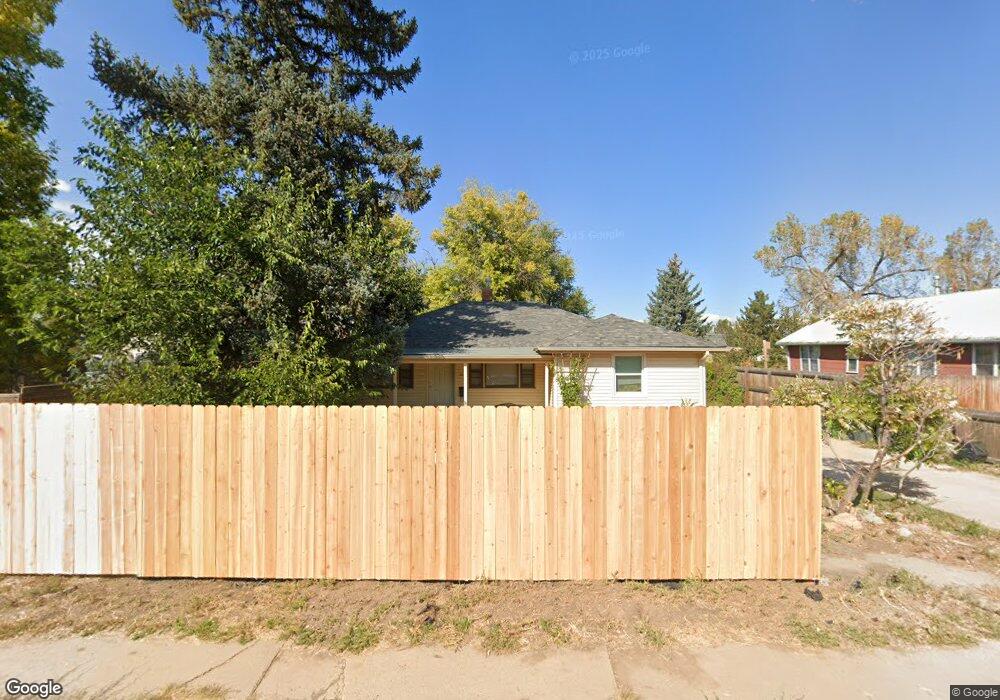
313 W Baseline Rd Lafayette, CO 80026
Estimated Value: $566,000 - $666,000
3
Beds
2
Baths
1,721
Sq Ft
$355/Sq Ft
Est. Value
About This Home
This home is located at 313 W Baseline Rd, Lafayette, CO 80026 and is currently estimated at $610,773, approximately $354 per square foot. 313 W Baseline Rd is a home located in Boulder County with nearby schools including Alicia Sanchez International Elementary School, Angevine Middle School, and Centaurus High School.
Ownership History
Date
Name
Owned For
Owner Type
Purchase Details
Closed on
Aug 11, 2003
Sold by
Rodriguez Manon I and Rodriguez Daniel
Bought by
Rodriguez Manon I and Rodriguez Daniel
Current Estimated Value
Purchase Details
Closed on
May 30, 2003
Sold by
Rodriguez Manon I and Rodriguez Daniel
Bought by
Kroiss Luke G
Home Financials for this Owner
Home Financials are based on the most recent Mortgage that was taken out on this home.
Original Mortgage
$148,000
Interest Rate
5.24%
Mortgage Type
Purchase Money Mortgage
Purchase Details
Closed on
Apr 2, 2001
Sold by
Therese Rodriguez Manon I and Therese Daniel
Bought by
Rodriguez Manon I
Purchase Details
Closed on
Oct 1, 1997
Sold by
Gillaspy Bradley L and Gillaspy Mary L
Bought by
Rodriguez Manon I
Home Financials for this Owner
Home Financials are based on the most recent Mortgage that was taken out on this home.
Original Mortgage
$123,006
Interest Rate
7.49%
Mortgage Type
FHA
Purchase Details
Closed on
May 26, 1989
Bought by
Koiss Luke G
Create a Home Valuation Report for This Property
The Home Valuation Report is an in-depth analysis detailing your home's value as well as a comparison with similar homes in the area
Home Values in the Area
Average Home Value in this Area
Purchase History
| Date | Buyer | Sale Price | Title Company |
|---|---|---|---|
| Rodriguez Manon I | -- | -- | |
| Kroiss Luke G | $185,000 | -- | |
| Rodriguez Manon I | -- | -- | |
| Rodriguez Manon I | $124,000 | First American Heritage Titl | |
| Koiss Luke G | -- | -- |
Source: Public Records
Mortgage History
| Date | Status | Borrower | Loan Amount |
|---|---|---|---|
| Previous Owner | Kroiss Luke G | $148,000 | |
| Previous Owner | Rodriguez Manon I | $123,006 | |
| Closed | Kroiss Luke G | $27,700 |
Source: Public Records
Tax History Compared to Growth
Tax History
| Year | Tax Paid | Tax Assessment Tax Assessment Total Assessment is a certain percentage of the fair market value that is determined by local assessors to be the total taxable value of land and additions on the property. | Land | Improvement |
|---|---|---|---|---|
| 2025 | $2,812 | $31,994 | $12,500 | $19,494 |
| 2024 | $2,812 | $31,994 | $12,500 | $19,494 |
| 2023 | $2,764 | $31,731 | $16,087 | $19,330 |
| 2022 | $2,442 | $26,000 | $11,301 | $14,699 |
| 2021 | $2,416 | $26,748 | $11,626 | $15,122 |
| 2020 | $2,328 | $25,475 | $9,867 | $15,608 |
| 2019 | $2,296 | $25,475 | $9,867 | $15,608 |
| 2018 | $2,156 | $23,616 | $8,640 | $14,976 |
| 2017 | $2,099 | $26,109 | $9,552 | $16,557 |
| 2016 | $1,647 | $17,941 | $7,084 | $10,857 |
| 2015 | $1,543 | $17,234 | $5,811 | $11,423 |
| 2014 | $1,490 | $17,234 | $5,811 | $11,423 |
Source: Public Records
Map
Nearby Homes
- 200 S Carr Ave
- 403 W Cannon St
- 0 Rainbow Ln
- 201 E Cleveland St
- 736 Gateway Cir
- 743 Cristo Ln
- 303 E Geneseo St
- 2-Story Alley Load Duplex - Butterfly Plan at Silver Creek
- 511 S Roosevelt Ave
- 490 E Sutton Cir
- 411 Levi Ln
- 921 Latigo Loop
- 917 Latigo Loop
- 104 Lucerne Dr
- 306 E Cannon St
- 200 Wellington Ave
- 406 E Cleveland St
- 1140 Devonshire Ct
- 1125 Somerset St
- 655 N Gooseberry Ct
- 315 W Baseline Rd
- 311 W Baseline Rd
- 309 W Baseline Rd
- 0 W Baseline Rd
- 310 Sheader Ave
- 401 W Baseline Rd
- 307 W Oak St
- 307 W Baseline Rd
- 409 W Baseline Rd
- 308 W Oak St
- 310 W Baseline Rd
- 400 W Baseline Rd Unit C
- 400 W Baseline Rd Unit B
- 400 W Baseline Rd Unit A1
- 400 W Baseline Rd Unit A-C2
- 400 W Baseline Rd Unit A-C1
- 400 W Baseline Rd
- 400 W Baseline Rd Unit A
- 402 W Baseline Rd Unit D
- 402 W Baseline Rd Unit C