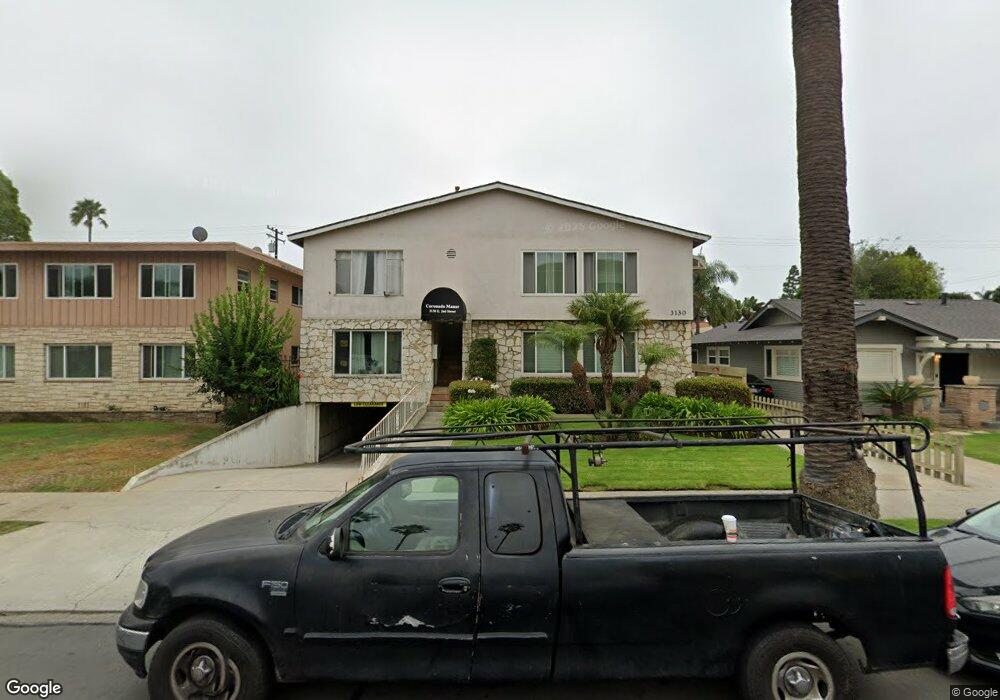
3130 E 2nd St Unit 1 Long Beach, CA 90803
Bluff Park NeighborhoodEstimated Value: $448,000 - $561,000
1
Bed
1
Bath
846
Sq Ft
$599/Sq Ft
Est. Value
About This Home
This home is located at 3130 E 2nd St Unit 1, Long Beach, CA 90803 and is currently estimated at $506,978, approximately $599 per square foot. 3130 E 2nd St Unit 1 is a home located in Los Angeles County with nearby schools including Mann Elementary School, Woodrow Wilson High School, and Maple Village Waldorf School.
Ownership History
Date
Name
Owned For
Owner Type
Purchase Details
Closed on
May 31, 2019
Sold by
Hanna Sam W and Hanna Alda K
Bought by
Hanna Sam W and Hanna Alda K
Current Estimated Value
Purchase Details
Closed on
Mar 22, 2015
Sold by
Soto Susana
Bought by
Soto Susana and The Susana Soto Living Trust
Purchase Details
Closed on
Mar 12, 2013
Sold by
Soto Susana
Bought by
Soto Susana
Home Financials for this Owner
Home Financials are based on the most recent Mortgage that was taken out on this home.
Original Mortgage
$101,250
Interest Rate
3.87%
Mortgage Type
New Conventional
Purchase Details
Closed on
Mar 14, 2006
Sold by
Soto Silvano and Soto Susana
Bought by
Soto Susana
Purchase Details
Closed on
Oct 18, 1999
Sold by
Carufel Bernadine M
Bought by
Soto Silvano and Soto Susana
Home Financials for this Owner
Home Financials are based on the most recent Mortgage that was taken out on this home.
Original Mortgage
$72,900
Interest Rate
7.68%
Create a Home Valuation Report for This Property
The Home Valuation Report is an in-depth analysis detailing your home's value as well as a comparison with similar homes in the area
Home Values in the Area
Average Home Value in this Area
Purchase History
| Date | Buyer | Sale Price | Title Company |
|---|---|---|---|
| Hanna Sam W | -- | Old Republic Title Company | |
| Soto Susana | -- | None Available | |
| Soto Susana | -- | North American Title | |
| Soto Susana | -- | None Available | |
| Soto Silvano | $81,000 | Chicago Title |
Source: Public Records
Mortgage History
| Date | Status | Borrower | Loan Amount |
|---|---|---|---|
| Previous Owner | Soto Susana | $101,250 | |
| Previous Owner | Soto Silvano | $72,900 |
Source: Public Records
Tax History
| Year | Tax Paid | Tax Assessment Tax Assessment Total Assessment is a certain percentage of the fair market value that is determined by local assessors to be the total taxable value of land and additions on the property. | Land | Improvement |
|---|---|---|---|---|
| 2025 | $1,756 | $124,469 | $31,648 | $92,821 |
| 2024 | $1,756 | $122,029 | $31,028 | $91,001 |
| 2023 | $1,724 | $119,637 | $30,420 | $89,217 |
| 2022 | $1,623 | $117,292 | $29,824 | $87,468 |
| 2021 | $1,585 | $114,993 | $29,240 | $85,753 |
| 2020 | $1,580 | $113,815 | $28,941 | $84,874 |
| 2019 | $1,562 | $111,584 | $28,374 | $83,210 |
| 2018 | $1,519 | $109,397 | $27,818 | $81,579 |
| 2016 | $1,397 | $105,151 | $26,739 | $78,412 |
| 2015 | $1,344 | $103,573 | $26,338 | $77,235 |
| 2014 | $1,341 | $101,546 | $25,823 | $75,723 |
Source: Public Records
Map
Nearby Homes
- 3130 E 2nd St Unit 10
- 39 Coronado Ave Unit 4
- 219 Redondo Ave
- 2999 E Ocean Blvd Unit 120
- 247 Redondo Ave
- 2767 E Ocean Blvd
- 3609 E 2nd St Unit 207
- 2718 E 2nd St
- 2730 E Mariquita St
- 308 Coronado Ave
- 2805 E 3rd St Unit 21
- 2805 E 3rd St Unit 20
- 280 Molino Ave Unit 108
- 7 37th Place
- 3665 E 1st St Unit 408
- 2601 E Ocean Blvd Unit 205
- 3737 E 2nd St Unit 301
- 210 Grand Ave Unit 201
- 337 Temple Ave
- 207 Mira Mar Ave
- 3130 E 2nd St
- 3130 E 2nd St Unit 12
- 3130 E 2nd St Unit 11
- 3130 E 2nd St Unit 9
- 3130 E 2nd St Unit 8
- 3130 E 2nd St Unit 7
- 3130 E 2nd St Unit 6
- 3130 E 2nd St Unit 5
- 3130 E 2nd St Unit 4
- 3130 E 2nd St Unit 3
- 3130 E 2nd St Unit 2
- 3134 E 2nd St
- 3120 E 2nd St
- 3204 E 2nd St
- 3112 E 2nd St
- 116 Paloma Ave
- 3100 E 2nd St
- 3218 E 2nd St Unit 3218 Upper
- 3216 E 2nd St
- 3216 E 2nd St Unit Lower
Your Personal Tour Guide
Ask me questions while you tour the home.