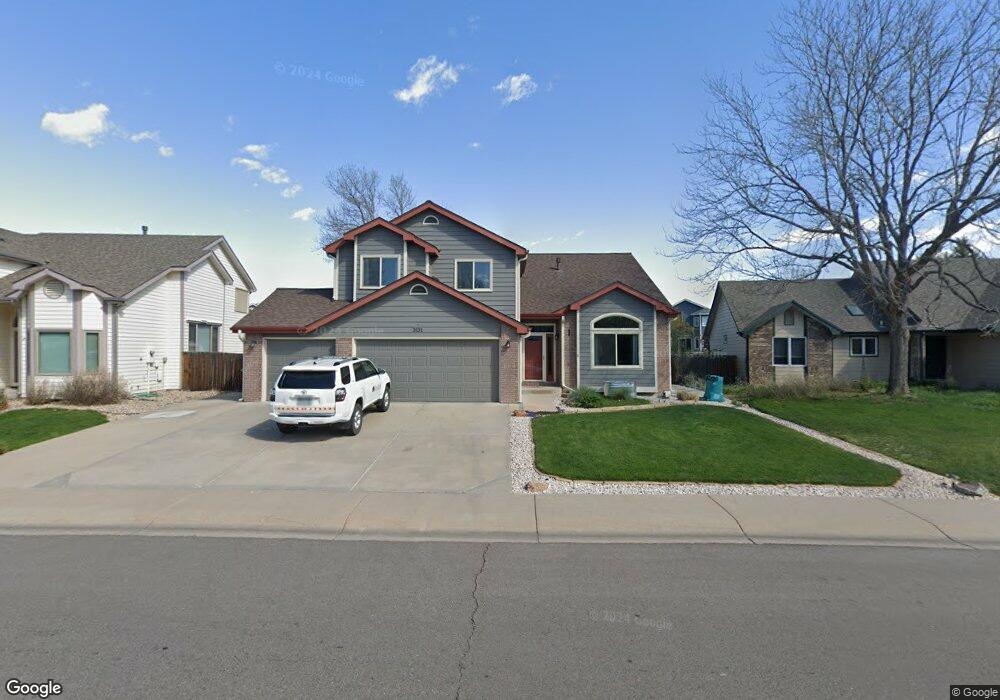
3131 Red Mountain Dr Fort Collins, CO 80525
Dakota Ridge NeighborhoodEstimated Value: $644,044 - $731,000
4
Beds
4
Baths
2,432
Sq Ft
$286/Sq Ft
Est. Value
About This Home
This home is located at 3131 Red Mountain Dr, Fort Collins, CO 80525 and is currently estimated at $695,761, approximately $286 per square foot. 3131 Red Mountain Dr is a home located in Larimer County with nearby schools including Shepardson Elementary School, Lesher Middle School, and Fort Collins High School.
Ownership History
Date
Name
Owned For
Owner Type
Purchase Details
Closed on
Feb 16, 2007
Sold by
Bonham Lori J
Bought by
Smith Susan D and Smith Keith A
Current Estimated Value
Home Financials for this Owner
Home Financials are based on the most recent Mortgage that was taken out on this home.
Original Mortgage
$178,000
Outstanding Balance
$106,674
Interest Rate
6.17%
Mortgage Type
Purchase Money Mortgage
Estimated Equity
$589,087
Purchase Details
Closed on
Mar 12, 2003
Sold by
Conn Dale J and Conn Judy L
Bought by
Bonham Lori J
Purchase Details
Closed on
Jun 1, 1994
Sold by
C & M Homes Inc
Bought by
Conn Dale J
Purchase Details
Closed on
Feb 1, 1994
Sold by
Cdl Partnership
Bought by
C & M Homes Inc
Purchase Details
Closed on
Jan 1, 1994
Sold by
Cdl Partnership
Bought by
C & M Homes Inc
Purchase Details
Closed on
Nov 1, 1993
Sold by
Timberline Partners Limited
Bought by
Cdl Partnership
Create a Home Valuation Report for This Property
The Home Valuation Report is an in-depth analysis detailing your home's value as well as a comparison with similar homes in the area
Home Values in the Area
Average Home Value in this Area
Purchase History
| Date | Buyer | Sale Price | Title Company |
|---|---|---|---|
| Smith Susan D | $277,900 | Security Title | |
| Bonham Lori J | $276,500 | -- | |
| Conn Dale J | $161,500 | -- | |
| C & M Homes Inc | -- | -- | |
| C & M Homes Inc | $29,000 | -- | |
| Cdl Partnership | $406,100 | -- |
Source: Public Records
Mortgage History
| Date | Status | Borrower | Loan Amount |
|---|---|---|---|
| Open | Smith Susan D | $178,000 |
Source: Public Records
Tax History Compared to Growth
Tax History
| Year | Tax Paid | Tax Assessment Tax Assessment Total Assessment is a certain percentage of the fair market value that is determined by local assessors to be the total taxable value of land and additions on the property. | Land | Improvement |
|---|---|---|---|---|
| 2025 | $3,967 | $45,031 | $3,350 | $41,681 |
| 2024 | $3,775 | $45,031 | $3,350 | $41,681 |
| 2022 | $3,182 | $33,701 | $3,475 | $30,226 |
| 2021 | $3,216 | $34,670 | $3,575 | $31,095 |
| 2020 | $3,018 | $32,261 | $3,575 | $28,686 |
| 2019 | $3,032 | $32,261 | $3,575 | $28,686 |
| 2018 | $2,562 | $28,109 | $3,600 | $24,509 |
| 2017 | $2,553 | $28,109 | $3,600 | $24,509 |
| 2016 | $2,434 | $26,658 | $3,980 | $22,678 |
| 2015 | $2,416 | $26,660 | $3,980 | $22,680 |
| 2014 | $2,233 | $24,480 | $3,980 | $20,500 |
Source: Public Records
Map
Nearby Homes
- 2718 Red Cloud Ct
- 2501 Jadestone Ct
- 2908 Des Moines Dr
- 2550 Custer Dr
- 3115 Bryce Dr
- 2521 Des Moines Dr Unit 104
- 3114 Bryce Dr
- 3150 Bryce Dr
- 2780 Canby Way
- 2556 Des Moines Dr Unit 103
- 2702 Rigden Pkwy Unit F4
- 2702 Rigden Pkwy Unit 1
- 3214 Anika Dr
- 3012 Sombrero Ln
- 2750 Illinois Dr Unit 206
- 2975 Denver Dr
- 2241 Limon Dr Unit 204
- 2500 Wapiti Rd
- 2961 Sagebrush Dr
- 2500 Kodiak Rd
- 3125 Red Mountain Dr
- 3137 Red Mountain Dr
- 2542 Pinecone Cir
- 3119 Red Mountain Dr
- 2619 Shavano Ct
- 2536 Pinecone Cir
- 3124 Red Mountain Dr
- 2613 Shavano Ct
- 3118 Red Mountain Dr
- 3130 Red Mountain Dr
- 3113 Red Mountain Dr
- 3112 Red Mountain Dr
- 3201 Red Mountain Dr
- 2630 Shavano Ct
- 3200 Red Mountain Dr
- 2530 Pinecone Cir
- 2607 Shavano Ct
- 2543 Pinecone Cir
- 3106 Red Mountain Dr
- 3107 Red Mountain Dr