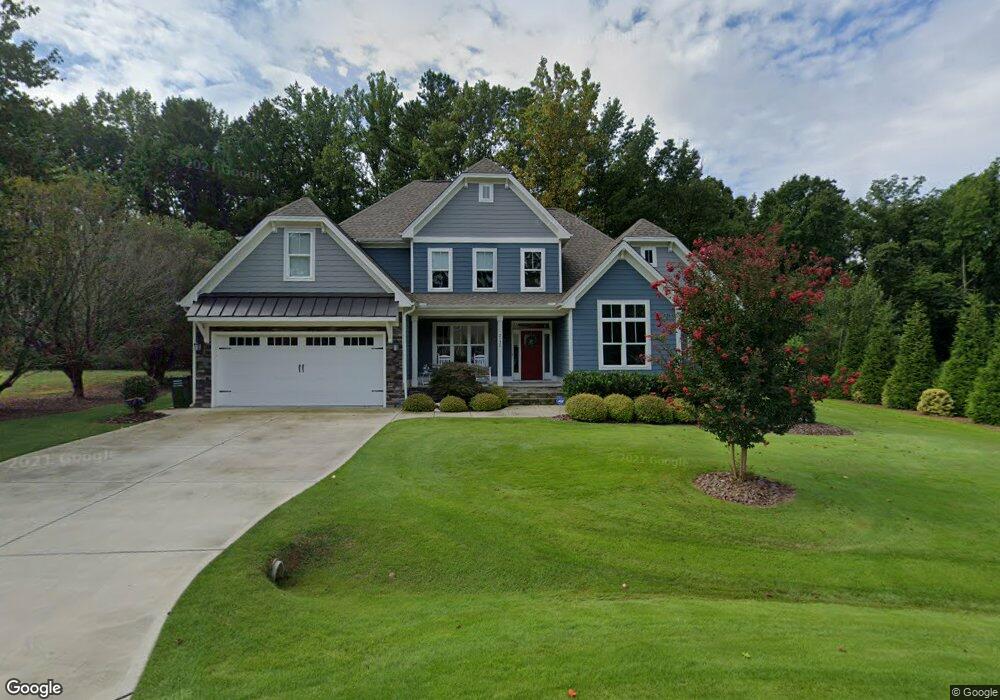
3132 Constance Cir Unit 7 Raleigh, NC 27603
South Raleigh NeighborhoodEstimated Value: $619,000 - $746,000
Studio
--
Bath
3,119
Sq Ft
$222/Sq Ft
Est. Value
About This Home
This home is located at 3132 Constance Cir Unit 7, Raleigh, NC 27603 and is currently estimated at $691,632, approximately $221 per square foot. 3132 Constance Cir Unit 7 is a home located in Wake County with nearby schools including Banks Road Elementary School.
Ownership History
Date
Name
Owned For
Owner Type
Purchase Details
Closed on
Aug 22, 2025
Sold by
Pickering Amanda H
Bought by
Amanda H Pickering 2025 Revocable Trust and Pickering
Current Estimated Value
Purchase Details
Closed on
Jan 17, 2017
Sold by
Statement Custom Homes Llc
Bought by
Pickering David G and Pickering Amanda H
Home Financials for this Owner
Home Financials are based on the most recent Mortgage that was taken out on this home.
Original Mortgage
$344,800
Interest Rate
3.12%
Mortgage Type
Construction
Purchase Details
Closed on
Nov 29, 2016
Sold by
Rowland Neal Morris
Bought by
Statement Custom Homes Llc
Home Financials for this Owner
Home Financials are based on the most recent Mortgage that was taken out on this home.
Original Mortgage
$344,800
Interest Rate
3.12%
Mortgage Type
Construction
Create a Home Valuation Report for This Property
The Home Valuation Report is an in-depth analysis detailing your home's value as well as a comparison with similar homes in the area
Home Values in the Area
Average Home Value in this Area
Purchase History
| Date | Buyer | Sale Price | Title Company |
|---|---|---|---|
| Amanda H Pickering 2025 Revocable Trust | -- | None Listed On Document | |
| Amanda H Pickering 2025 Revocable Trust | -- | None Listed On Document | |
| Pickering David G | $70,000 | None Available | |
| Statement Custom Homes Llc | $70,000 | None Available |
Source: Public Records
Mortgage History
| Date | Status | Borrower | Loan Amount |
|---|---|---|---|
| Previous Owner | Pickering David G | $344,800 |
Source: Public Records
Tax History
| Year | Tax Paid | Tax Assessment Tax Assessment Total Assessment is a certain percentage of the fair market value that is determined by local assessors to be the total taxable value of land and additions on the property. | Land | Improvement |
|---|---|---|---|---|
| 2025 | $4,271 | $664,616 | $135,000 | $529,616 |
| 2024 | $4,147 | $664,616 | $135,000 | $529,616 |
Source: Public Records
Map
Nearby Homes
- 9812 Chris Dr
- 9600 Chris Dr
- 4301 Banks Stone Dr
- 9008 Chelsea Dr
- 2805 Banks Rd
- 2809 Banks Rd
- 3205 Banks Rd
- 4005 Sorrell Brothers Ct
- 4012 Sorrell Brothers Ct
- 10136 Fanny Brown Rd
- 4812 Trotter Dr
- 2840 Banks Rd
- 2039 Travern Dr
- 2044 Travern Dr
- 0 Ten Rd Unit 10118279
- 8035 Gilano Dr
- 8413 Fayetteville Rd Unit 14
- 545 Prestonfield Way
- 109 Tawny Slope Ct
- 109 Tawny Slope Ct Unit 13
- 3132 Constance Cir
- 3128 Constance Cir Unit 8
- 3128 Constance Cir
- 3136 Constance Cir
- 3136 Constance Cir Unit 6
- 3124 Constance Cir Unit 9
- 3124 Constance Cir
- 3129 Constance Cir
- 3129 Constance Cir Unit 19
- 3142 Cotten Rd
- 3140 Cotten Rd
- 3136 Cotten Rd
- 3135 Constance Cir
- 3135 Constance Cir Unit 20
- 3120 Constance Cir
- 3120 Constance Cir Unit 10
- 3124 Cotten Rd
- 3139 Constance Cir
- 3139 Constance Cir Unit 21
- 3113 Constance Cir
Your Personal Tour Guide
Ask me questions while you tour the home.