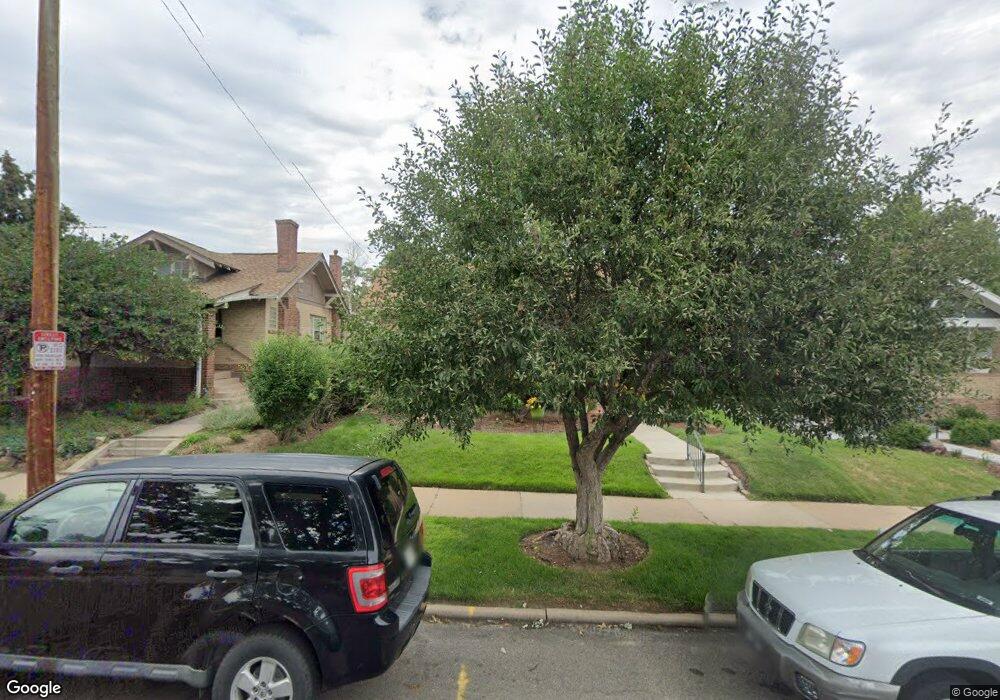
3135 W 40th Ave Denver, CO 80211
Berkeley NeighborhoodEstimated Value: $459,000 - $704,000
2
Beds
1
Bath
840
Sq Ft
$715/Sq Ft
Est. Value
About This Home
This home is located at 3135 W 40th Ave, Denver, CO 80211 and is currently estimated at $600,782, approximately $715 per square foot. 3135 W 40th Ave is a home located in Denver County with nearby schools including Columbian Elementary School, Bryant Webster Dual Language School, and Skinner Middle School.
Ownership History
Date
Name
Owned For
Owner Type
Purchase Details
Closed on
Jul 22, 2015
Sold by
Christensen Antoinette
Bought by
Christensen Donald R and Christensen Antoinette
Current Estimated Value
Purchase Details
Closed on
Sep 17, 1997
Sold by
Christensen Donald L and Antoinet Christensen
Bought by
Christensen Donald L and Christensen Antionette
Home Financials for this Owner
Home Financials are based on the most recent Mortgage that was taken out on this home.
Original Mortgage
$42,200
Interest Rate
7.59%
Create a Home Valuation Report for This Property
The Home Valuation Report is an in-depth analysis detailing your home's value as well as a comparison with similar homes in the area
Home Values in the Area
Average Home Value in this Area
Purchase History
We collect this data history from publicly available records. To have your information removed, we recommend requesting removal directly through your county’s website.
| Date | Buyer | Sale Price | Title Company |
|---|---|---|---|
| Christensen Donald R | -- | None Available | |
| Christensen Donald L | -- | -- |
Source: Public Records
Mortgage History
We collect this data history from publicly available records. To have your information removed, we recommend requesting removal directly through your county’s website.
| Date | Status | Borrower | Loan Amount |
|---|---|---|---|
| Previous Owner | Christensen Donald L | $42,200 |
Source: Public Records
Tax History
| Year | Tax Paid | Tax Assessment Tax Assessment Total Assessment is a certain percentage of the fair market value that is determined by local assessors to be the total taxable value of land and additions on the property. | Land | Improvement |
|---|---|---|---|---|
| 2025 | $3,330 | $40,000 | $22,590 | $22,590 |
| 2024 | $3,330 | $42,050 | $17,780 | $24,270 |
| 2023 | $3,258 | $42,050 | $17,780 | $24,270 |
| 2022 | $2,750 | $34,580 | $21,440 | $13,140 |
| 2021 | $2,121 | $35,580 | $22,060 | $13,520 |
| 2020 | $2,037 | $34,600 | $22,090 | $12,510 |
| 2019 | $1,980 | $34,600 | $22,090 | $12,510 |
| 2018 | $1,684 | $28,970 | $16,480 | $12,490 |
| 2017 | $1,679 | $28,970 | $16,480 | $12,490 |
| 2016 | $1,475 | $26,050 | $13,659 | $12,391 |
| 2015 | $1,413 | $26,050 | $13,659 | $12,391 |
| 2014 | $951 | $19,410 | $7,291 | $12,119 |
Source: Public Records
Map
Nearby Homes
- 3176 W 39th Ave
- 3037 W 39th Ave
- 3035 W 39th Ave
- 4185 Grove St
- 3034 W Denver Place
- 3024 W Denver Place
- 3130 W 38th Ave Unit 4
- 3312 W 38th Ave
- 3042 W 38th Ave
- 4136 King St
- 2929 W 39th Ave
- 3360 W 38th Ave Unit West10
- 4265 Irving St
- 4283 Hooker St
- 4277 Green Ct
- 3311 W Clyde Place
- 2922 W 39th Ave
- 4230 Knox Ct
- 3119 W 44th Ave
- 3690 W 38th Ave
- 3139 W 40th Ave
- 3129 W 40th Ave
- 3145 W 40th Ave
- 3119 W 40th Ave
- 3155 W 40th Ave
- 3132 W 41st Ave
- 4035 Grove St
- 3126 W 41st Ave
- 3138 W 41st Ave
- 4025 Grove St
- 3120 W 41st Ave
- 3142 W 41st Ave
- 3163 W 40th Ave
- 3128 W 40th Ave
- 3120 W 40th Ave
- 3134 W 40th Ave
- 3152 W 41st Ave
- 3114 W 41st Ave
- 3118 W 40th Ave
- 3138 W 40th Ave
Your Personal Tour Guide
Ask me questions while you tour the home.