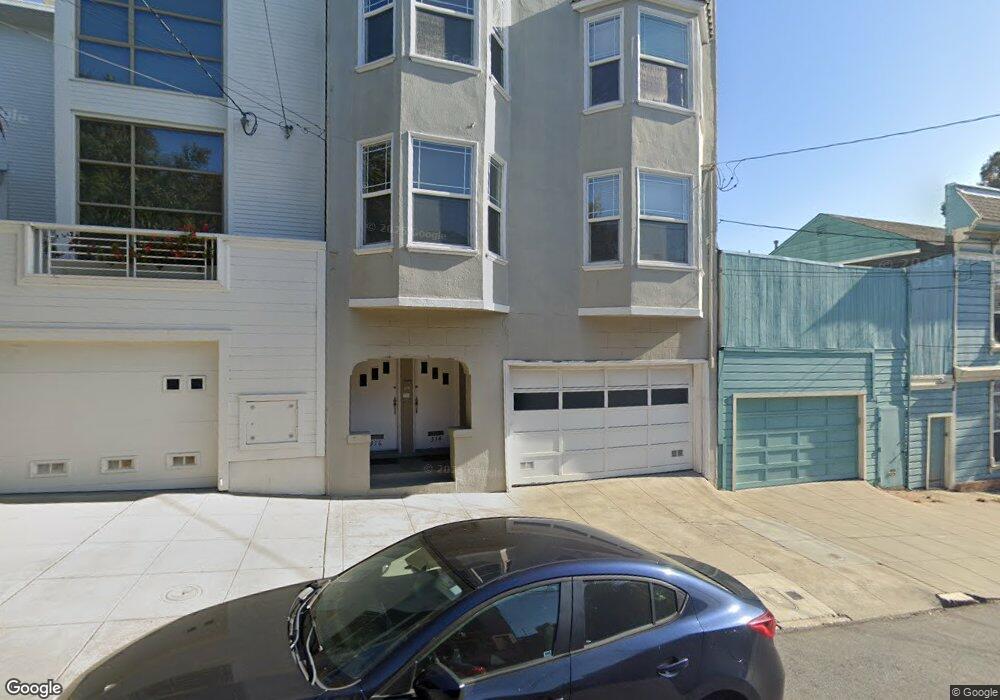
314 27th St Unit 316 San Francisco, CA 94131
Noe Valley NeighborhoodEstimated Value: $1,754,000 - $2,251,000
--
Bed
2
Baths
2,250
Sq Ft
$845/Sq Ft
Est. Value
About This Home
This home is located at 314 27th St Unit 316, San Francisco, CA 94131 and is currently estimated at $1,900,423, approximately $844 per square foot. 314 27th St Unit 316 is a home located in San Francisco County with nearby schools including Alvarado Elementary, James Lick Middle School, and Creative Arts Charter School.
Ownership History
Date
Name
Owned For
Owner Type
Purchase Details
Closed on
Apr 22, 2021
Sold by
Boden Ricki A
Bought by
Boden Ricki A and Ricki Boden 1999 Trust
Current Estimated Value
Purchase Details
Closed on
Apr 22, 2016
Sold by
Andrea Lyons 1999 Trust and Boden Ricki A
Bought by
Boden Ricki A
Purchase Details
Closed on
Nov 27, 2015
Sold by
Boden Ricki A and Lyons Andrea B
Bought by
Andrea Lyons & Ricki Boden 1999 Trust
Purchase Details
Closed on
Nov 4, 2015
Sold by
Boden Ricki and Lyons Andrea
Bought by
Boden Ricki A and Lyons Andrea V
Purchase Details
Closed on
Nov 4, 1999
Sold by
Boden Ricki V and Boden Lyons V
Bought by
Boden Ricki and Lyons Andrea
Purchase Details
Closed on
Dec 8, 1993
Sold by
Lyons Andrea Vincent
Bought by
Lyons Andrea Vincent
Create a Home Valuation Report for This Property
The Home Valuation Report is an in-depth analysis detailing your home's value as well as a comparison with similar homes in the area
Home Values in the Area
Average Home Value in this Area
Purchase History
| Date | Buyer | Sale Price | Title Company |
|---|---|---|---|
| Boden Ricki A | -- | None Available | |
| Boden Ricki A | -- | None Available | |
| Boden Ricki A | -- | None Available | |
| Boden Ricki A | -- | None Listed On Document | |
| Andrea Lyons & Ricki Boden 1999 Trust | -- | None Available | |
| Boden Ricki A | -- | None Available | |
| Boden Ricki A | -- | None Available | |
| Boden Ricki | -- | -- | |
| Lyons Andrea Vincent | -- | Chicago Title Company |
Source: Public Records
Tax History Compared to Growth
Tax History
| Year | Tax Paid | Tax Assessment Tax Assessment Total Assessment is a certain percentage of the fair market value that is determined by local assessors to be the total taxable value of land and additions on the property. | Land | Improvement |
|---|---|---|---|---|
| 2025 | $3,358 | $223,646 | $44,305 | $179,341 |
| 2024 | $3,358 | $219,264 | $43,437 | $175,827 |
| 2023 | $3,298 | $214,968 | $42,586 | $172,382 |
| 2022 | $3,219 | $210,756 | $41,752 | $169,004 |
| 2021 | $3,075 | $206,674 | $40,950 | $165,724 |
| 2020 | $3,108 | $204,557 | $40,531 | $164,026 |
| 2019 | $3,005 | $200,548 | $39,737 | $160,811 |
| 2018 | $2,904 | $196,617 | $38,958 | $157,659 |
| 2017 | $2,570 | $192,764 | $38,195 | $154,569 |
| 2016 | $2,498 | $188,946 | $37,431 | $151,515 |
| 2015 | $2,463 | $186,112 | $36,870 | $149,242 |
| 2014 | $2,399 | $182,470 | $36,149 | $146,321 |
Source: Public Records
Map
Nearby Homes
- 3936 26th St
- 245 Duncan St
- 4047 Cesar Chavez St
- 4040 Cesar Chavez
- 248 Valley St
- 1325 Church St Unit 1325
- 4044 26th St
- 101 28th St
- 1541 Sanchez St
- 1300 Church St
- 1463 Noe St
- 1485 Noe St
- 1474 Noe St
- 3779-3781 25th St
- 440-442 29th St
- 55 Valley St Unit 57
- 55 Valley St
- 55-57 Valley St
- 561 Duncan St
- 222 Jersey St
- 318 27th St
- 324 27th St
- 1474 Church St Unit 1476
- 1470 Church St
- 1480 Church St
- 326 27th St
- 1466 Church St Unit 3
- 1466 Church St Unit 4
- 1466 Church St Unit 1
- 1462 Church St Unit 1464
- 332 27th St
- 3915 Cesar Chavez St
- 3919 Cesar Chavez St
- 1458 Church St Unit 1460
- 3929 Cesar Chavez St
- 338 27th St
- 1454 Church St
- 3925 Cesar Chavez St
- 3927 Cesar Chavez St