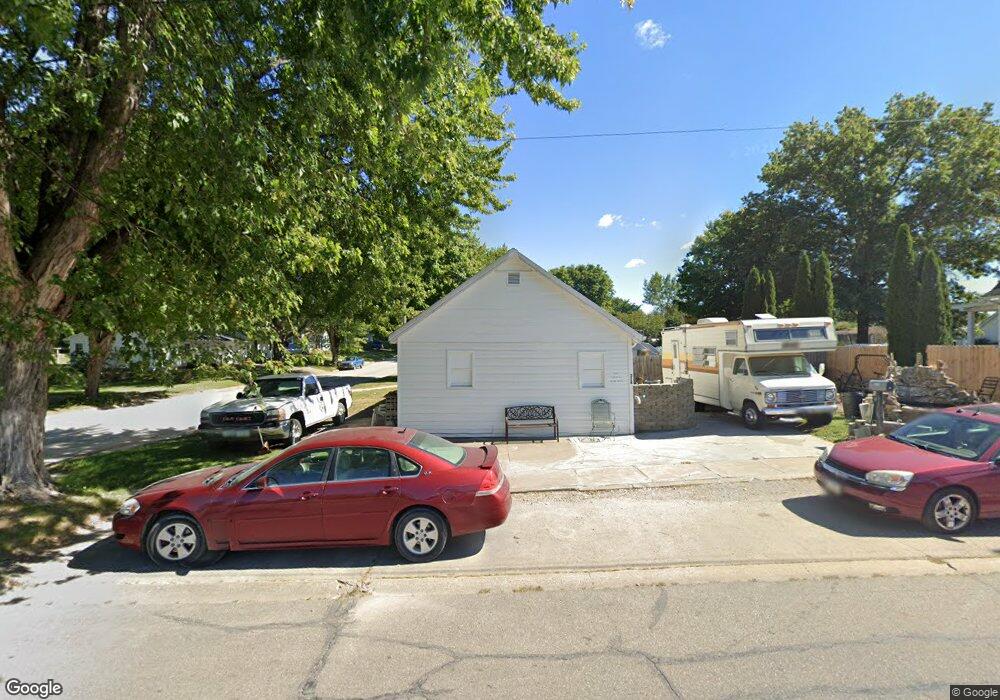
314 S 9th Ave Vinton, IA 52349
Estimated Value: $52,249 - $114,000
2
Beds
1
Bath
1,000
Sq Ft
$73/Sq Ft
Est. Value
About This Home
This home is located at 314 S 9th Ave, Vinton, IA 52349 and is currently estimated at $73,312, approximately $73 per square foot. 314 S 9th Ave is a home with nearby schools including Tilford Elementary School, Shellsburg Elementary School, and Vinton-Shellsburg Middle School.
Ownership History
Date
Name
Owned For
Owner Type
Purchase Details
Closed on
May 6, 2024
Sold by
Linda And Phillip Barkdoll Family Trust and Barkdoll Linda
Bought by
Applegarth Dennis
Current Estimated Value
Home Financials for this Owner
Home Financials are based on the most recent Mortgage that was taken out on this home.
Original Mortgage
$32,000
Outstanding Balance
$30,188
Interest Rate
6.11%
Mortgage Type
New Conventional
Estimated Equity
$43,124
Purchase Details
Closed on
Feb 22, 2022
Sold by
Linda And Phillip Barkdoll Family Trust
Bought by
Schumacher Erik W
Create a Home Valuation Report for This Property
The Home Valuation Report is an in-depth analysis detailing your home's value as well as a comparison with similar homes in the area
Home Values in the Area
Average Home Value in this Area
Purchase History
| Date | Buyer | Sale Price | Title Company |
|---|---|---|---|
| Applegarth Dennis | $40,000 | None Listed On Document | |
| Schumacher Erik W | $125,000 | None Listed On Document |
Source: Public Records
Mortgage History
| Date | Status | Borrower | Loan Amount |
|---|---|---|---|
| Open | Applegarth Dennis | $32,000 |
Source: Public Records
Tax History Compared to Growth
Tax History
| Year | Tax Paid | Tax Assessment Tax Assessment Total Assessment is a certain percentage of the fair market value that is determined by local assessors to be the total taxable value of land and additions on the property. | Land | Improvement |
|---|---|---|---|---|
| 2025 | $740 | $53,600 | $13,700 | $39,900 |
| 2024 | $740 | $49,700 | $13,400 | $36,300 |
| 2023 | $902 | $49,700 | $13,400 | $36,300 |
| 2022 | $9 | $41,900 | $10,700 | $31,200 |
| 2021 | $926 | $41,900 | $10,700 | $31,200 |
| 2020 | $904 | $41,800 | $8,900 | $32,900 |
| 2019 | $932 | $41,800 | $8,900 | $32,900 |
| 2018 | $904 | $42,500 | $8,600 | $33,900 |
| 2017 | $870 | $42,500 | $8,600 | $33,900 |
| 2016 | $856 | $39,700 | $8,000 | $31,700 |
| 2015 | $856 | $39,700 | $8,000 | $31,700 |
| 2014 | $950 | $43,900 | $0 | $0 |
Source: Public Records
Map
Nearby Homes