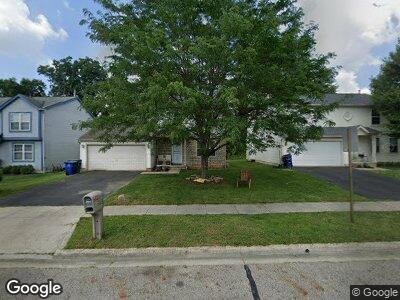
3141 Framingham Cir Columbus, OH 43224
Framingham NeighborhoodEstimated Value: $257,960 - $279,000
3
Beds
3
Baths
1,381
Sq Ft
$194/Sq Ft
Est. Value
About This Home
This home is located at 3141 Framingham Cir, Columbus, OH 43224 and is currently estimated at $268,240, approximately $194 per square foot. 3141 Framingham Cir is a home located in Franklin County with nearby schools including Innis Elementary School, Mifflin Middle School, and Mifflin High School.
Ownership History
Date
Name
Owned For
Owner Type
Purchase Details
Closed on
Dec 11, 2006
Sold by
Countrywide Home Loans Inc
Bought by
Holmes Erika L
Current Estimated Value
Home Financials for this Owner
Home Financials are based on the most recent Mortgage that was taken out on this home.
Original Mortgage
$108,000
Outstanding Balance
$66,156
Interest Rate
6.21%
Mortgage Type
Seller Take Back
Estimated Equity
$193,866
Purchase Details
Closed on
Aug 21, 2006
Sold by
Bounds Toya M and Case #02Cve12 13605
Bought by
Countrywide Home Loans Inc
Purchase Details
Closed on
Apr 5, 2000
Sold by
Rockford Homes Inc
Bought by
Bounds Toya M
Home Financials for this Owner
Home Financials are based on the most recent Mortgage that was taken out on this home.
Original Mortgage
$114,500
Interest Rate
8.31%
Purchase Details
Closed on
Aug 13, 1999
Sold by
Columbus Housing Partnership Inc
Bought by
Rockford Homes Inc
Purchase Details
Closed on
Dec 1, 1986
Create a Home Valuation Report for This Property
The Home Valuation Report is an in-depth analysis detailing your home's value as well as a comparison with similar homes in the area
Home Values in the Area
Average Home Value in this Area
Purchase History
| Date | Buyer | Sale Price | Title Company |
|---|---|---|---|
| Holmes Erika L | $108,000 | Resource T | |
| Countrywide Home Loans Inc | $86,000 | Independent | |
| Bounds Toya M | $120,700 | Title First Agency Inc | |
| Rockford Homes Inc | $18,500 | Title First Agency Inc | |
| -- | -- | -- |
Source: Public Records
Mortgage History
| Date | Status | Borrower | Loan Amount |
|---|---|---|---|
| Open | Holmes Erika L | $108,000 | |
| Previous Owner | Bounds Toya M | $114,500 |
Source: Public Records
Tax History Compared to Growth
Tax History
| Year | Tax Paid | Tax Assessment Tax Assessment Total Assessment is a certain percentage of the fair market value that is determined by local assessors to be the total taxable value of land and additions on the property. | Land | Improvement |
|---|---|---|---|---|
| 2024 | $3,044 | $67,830 | $15,400 | $52,430 |
| 2023 | $3,005 | $67,830 | $15,400 | $52,430 |
| 2022 | $2,512 | $48,440 | $6,020 | $42,420 |
| 2021 | $2,517 | $48,440 | $6,020 | $42,420 |
| 2020 | $2,520 | $48,440 | $6,020 | $42,420 |
| 2019 | $2,334 | $38,470 | $4,830 | $33,640 |
| 2018 | $2,089 | $38,470 | $4,830 | $33,640 |
| 2017 | $2,184 | $38,470 | $4,830 | $33,640 |
| 2016 | $2,036 | $30,740 | $7,250 | $23,490 |
| 2015 | $1,849 | $30,740 | $7,250 | $23,490 |
| 2014 | $1,853 | $30,740 | $7,250 | $23,490 |
| 2013 | $1,074 | $36,120 | $8,505 | $27,615 |
Source: Public Records
Map
Nearby Homes
- 2495 Hingham Ln
- 3126 Dedham St
- 2525 Dexham Ct
- 2322 Mecca Rd
- 3310 Framington Dr
- 2270 Albert Ave
- 2858 Woodland Ave
- 3137 Westerville Rd Unit 44
- 3137 Westerville Rd Unit 37
- 3137 Westerville Rd Unit 36
- 3497 Hillcreek Ct
- 2559 Milford Ave
- 3484 Sweetday St
- 1980 Oakland Park Ave
- 2789 Berrell Ave
- 2685 Perdue Ave
- 1865 Agler Rd Unit 1867
- 1794 Audrey Rd
- 2100 Aberdeen Ave
- 1774 Audrey Rd
- 3141 Framingham Cir
- 3147 Framingham Cir
- 3135 Framingham Cir
- 3153 Framingham Cir
- 3131 Framingham Cir
- 3140 Framingham Cir
- 3159 Framingham Cir
- 3127 Framingham Cir
- 3146 Framingham Cir
- 3134 Framingham Cir
- 3152 Framingham Cir
- 3128 Framingham Cir
- 3123 Framingham Cir
- 3160 Framingham Cir
- 3122 Framingham Cir
- 3123 Mystic Ct
- 3131 Mystic Ct
- 3119 Framingham Cir
- 3139 Mystic Ct
- 3176 Boyleston Blvd