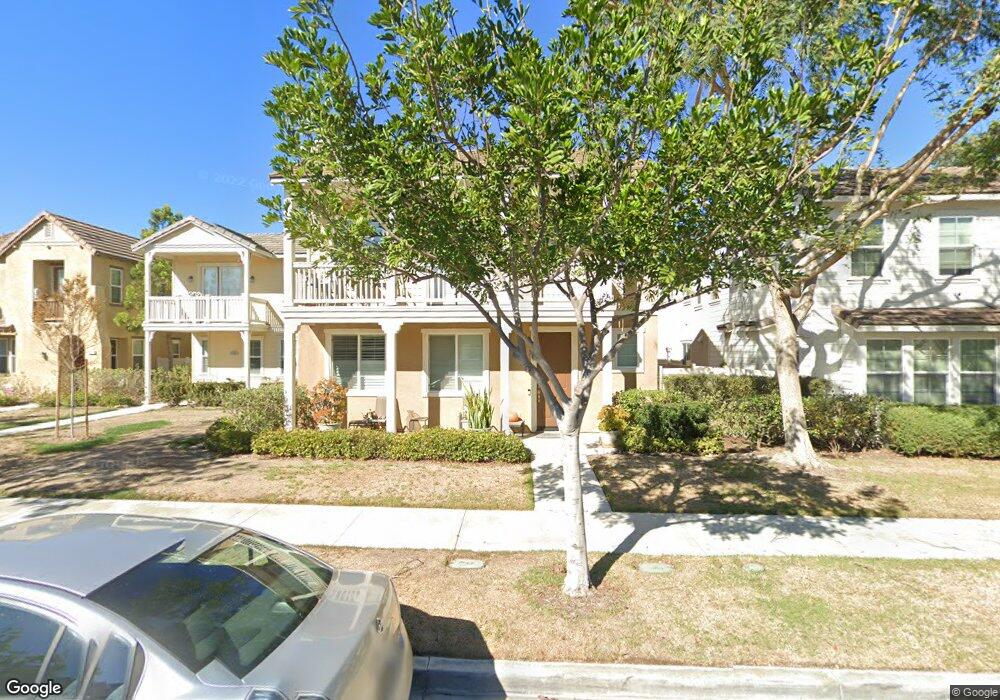
3145 Nimes Ln Oxnard, CA 93036
Town Center NeighborhoodEstimated Value: $752,000 - $828,000
3
Beds
4
Baths
1,604
Sq Ft
$488/Sq Ft
Est. Value
About This Home
This home is located at 3145 Nimes Ln, Oxnard, CA 93036 and is currently estimated at $783,446, approximately $488 per square foot. 3145 Nimes Ln is a home located in Ventura County with nearby schools including Rio Del Mar School, Rio Vista Middle School, and Rio Mesa High School.
Ownership History
Date
Name
Owned For
Owner Type
Purchase Details
Closed on
Dec 30, 2022
Sold by
Russell James and Russell Roxanne C
Bought by
Russell Family Trust and Russell
Current Estimated Value
Purchase Details
Closed on
May 10, 2012
Sold by
Citibank N A
Bought by
Russell James and Russell Roxanne C
Home Financials for this Owner
Home Financials are based on the most recent Mortgage that was taken out on this home.
Original Mortgage
$286,020
Interest Rate
3.84%
Mortgage Type
VA
Purchase Details
Closed on
Nov 1, 2010
Sold by
Aquino Khristian T and Aquino Honeyleth D R
Bought by
Citibank Na
Purchase Details
Closed on
Nov 9, 2006
Sold by
Standard Pacific Corp
Bought by
Aquino Khristian T and Aquino Honeyleth D R
Home Financials for this Owner
Home Financials are based on the most recent Mortgage that was taken out on this home.
Original Mortgage
$527,300
Interest Rate
6.87%
Mortgage Type
Negative Amortization
Create a Home Valuation Report for This Property
The Home Valuation Report is an in-depth analysis detailing your home's value as well as a comparison with similar homes in the area
Home Values in the Area
Average Home Value in this Area
Purchase History
| Date | Buyer | Sale Price | Title Company |
|---|---|---|---|
| Russell Family Trust | -- | None Listed On Document | |
| Russell James | $280,000 | Servicelink | |
| Citibank Na | $657,409 | Servicelink | |
| Aquino Khristian T | $659,500 | First American Title Company |
Source: Public Records
Mortgage History
| Date | Status | Borrower | Loan Amount |
|---|---|---|---|
| Previous Owner | Russell James | $286,020 | |
| Previous Owner | Aquino Khristian T | $527,300 |
Source: Public Records
Tax History
| Year | Tax Paid | Tax Assessment Tax Assessment Total Assessment is a certain percentage of the fair market value that is determined by local assessors to be the total taxable value of land and additions on the property. | Land | Improvement |
|---|---|---|---|---|
| 2025 | $9,170 | $351,683 | $175,842 | $175,841 |
| 2024 | $9,170 | $344,788 | $172,394 | $172,394 |
| 2023 | $8,455 | $338,028 | $169,014 | $169,014 |
| 2022 | $8,183 | $331,400 | $165,700 | $165,700 |
| 2021 | $8,081 | $324,902 | $162,451 | $162,451 |
| 2020 | $8,840 | $321,572 | $160,786 | $160,786 |
| 2019 | $8,681 | $315,268 | $157,634 | $157,634 |
| 2018 | $8,904 | $309,088 | $154,544 | $154,544 |
| 2017 | $8,814 | $303,028 | $151,514 | $151,514 |
| 2016 | $8,541 | $297,088 | $148,544 | $148,544 |
| 2015 | $8,507 | $292,626 | $146,313 | $146,313 |
| 2014 | $8,256 | $286,896 | $143,448 | $143,448 |
Source: Public Records
Map
Nearby Homes
- 3143 Moss Landing Blvd
- 3040 Moss Landing Blvd
- 3155 London Ln
- 3016 Moonlight Park Ave
- 3005 Roia Ln
- 613 Flathead River St
- 511 Nile River Dr
- 3014 N Oxnard Blvd
- 629 Forest Park Blvd
- 3100 N Ventura Rd
- 693 Nile River Dr
- 316 Elk River Place
- 669 Seine River Way
- 2715 Smokey Mountain Dr
- 652 Xanadu Way
- 2850 Wagon Wheel Rd Unit 402
- 2810 Wagon Wheel Rd Unit 304
- 2800 Wagon Wheel Rd Unit 304
- 2820 Wagon Wheel Rd Unit 302
- 2820 Wagon Wheel Rd Unit 403
- 3135 Nimes Ln
- 3155 Nimes Ln
- 3125 Nimes Ln
- 3152 Moss Landing Blvd
- 3142 Moss Landing Blvd
- 3148 Moss Landing Blvd
- 3130 Moss Landing Blvd
- 3124 Moss Landing Blvd
- 3105 Nimes Ln
- 3118 Moss Landing Blvd
- 3144 Nimes Ln
- 3112 Moss Landing Blvd
- 3106 Moss Landing Blvd
- 3154 Nimes Ln
- 3134 Nimes Ln
- 3124 Nimes Ln
- 3114 Nimes Ln
- 429 Kiawah River Dr
- 427 Kiawah River Dr
- 425 Kiawah River Dr
Your Personal Tour Guide
Ask me questions while you tour the home.