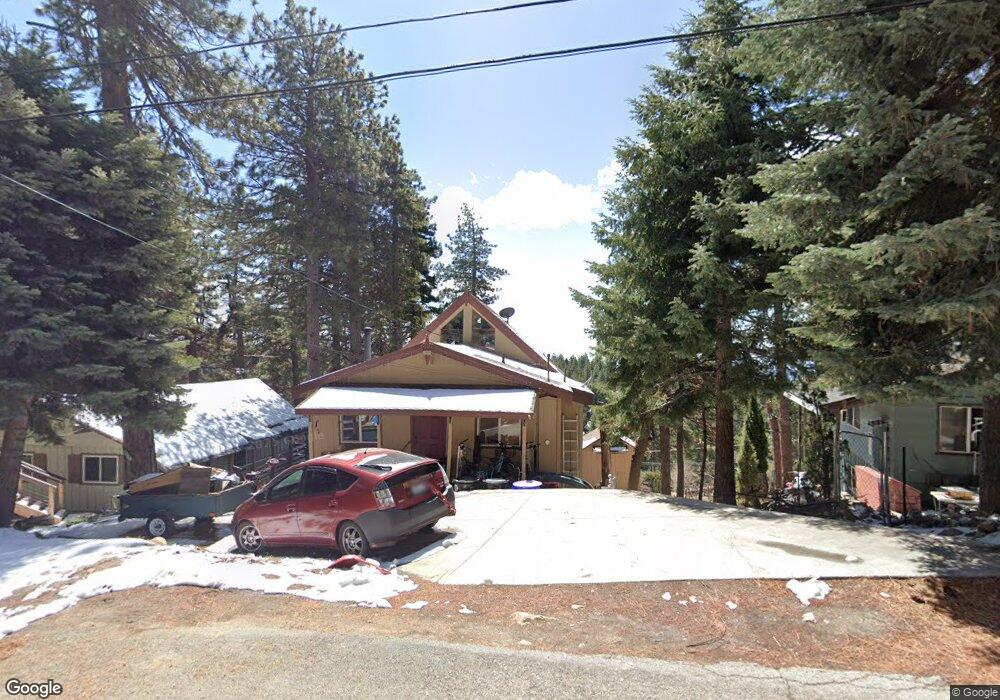
31479 Circle View Dr Running Springs, CA 92382
Estimated Value: $330,000 - $373,000
4
Beds
2
Baths
1,632
Sq Ft
$220/Sq Ft
Est. Value
About This Home
This home is located at 31479 Circle View Dr, Running Springs, CA 92382 and is currently estimated at $358,869, approximately $219 per square foot. 31479 Circle View Dr is a home located in San Bernardino County with nearby schools including Charles Hoffman Elementary School, Mary P. Henck Intermediate School, and Rim Of The World Senior High School.
Ownership History
Date
Name
Owned For
Owner Type
Purchase Details
Closed on
Jun 22, 2010
Sold by
Foster Steven K
Bought by
Passy Richard H I and Passy Shannon E
Current Estimated Value
Purchase Details
Closed on
Sep 20, 2005
Sold by
Foster Steven K
Bought by
Foster Steven K and Foster Denise E
Home Financials for this Owner
Home Financials are based on the most recent Mortgage that was taken out on this home.
Original Mortgage
$136,000
Outstanding Balance
$72,073
Interest Rate
5.7%
Mortgage Type
Fannie Mae Freddie Mac
Estimated Equity
$286,796
Purchase Details
Closed on
Sep 12, 2005
Sold by
Macchia Domenico
Bought by
Foster Steven K and Foster Denise E
Home Financials for this Owner
Home Financials are based on the most recent Mortgage that was taken out on this home.
Original Mortgage
$136,000
Outstanding Balance
$72,073
Interest Rate
5.7%
Mortgage Type
Fannie Mae Freddie Mac
Estimated Equity
$286,796
Purchase Details
Closed on
Feb 14, 2005
Sold by
Jauker Peter
Bought by
Macchia Domenico
Create a Home Valuation Report for This Property
The Home Valuation Report is an in-depth analysis detailing your home's value as well as a comparison with similar homes in the area
Home Values in the Area
Average Home Value in this Area
Purchase History
| Date | Buyer | Sale Price | Title Company |
|---|---|---|---|
| Passy Richard H I | -- | Stewart Title Of California | |
| Foster Steven K | -- | -- | |
| Foster Steven K | $170,000 | First American Ms | |
| Macchia Domenico | $95,000 | Ticor Title Co |
Source: Public Records
Mortgage History
| Date | Status | Borrower | Loan Amount |
|---|---|---|---|
| Open | Foster Steven K | $136,000 |
Source: Public Records
Tax History
| Year | Tax Paid | Tax Assessment Tax Assessment Total Assessment is a certain percentage of the fair market value that is determined by local assessors to be the total taxable value of land and additions on the property. | Land | Improvement |
|---|---|---|---|---|
| 2025 | $2,620 | $185,769 | $32,029 | $153,740 |
| 2024 | $2,423 | $182,126 | $31,401 | $150,725 |
| 2023 | $2,397 | $178,555 | $30,785 | $147,770 |
| 2022 | $2,353 | $175,054 | $30,181 | $144,873 |
| 2021 | $2,329 | $171,621 | $29,589 | $142,032 |
| 2020 | $2,329 | $169,862 | $29,286 | $140,576 |
| 2019 | $2,274 | $166,532 | $28,712 | $137,820 |
| 2018 | $2,270 | $163,267 | $28,149 | $135,118 |
| 2017 | $2,118 | $160,066 | $27,597 | $132,469 |
| 2016 | $2,057 | $156,928 | $27,056 | $129,872 |
| 2015 | $2,037 | $154,571 | $26,650 | $127,921 |
| 2014 | $2,005 | $151,543 | $26,128 | $125,415 |
Source: Public Records
Map
Nearby Homes
- 31466 Onacrest Dr
- 31321 Circle View Dr
- 31651 Wagon Wheel Dr
- 31661 Wagon Wheel Dr
- 2379 Spring Oak Dr
- 31442 Ocean View Dr
- 0 Valley View Dr
- 31435 Oakleaf Dr
- 2458 Spring Oak Dr
- 2402 Spring Oak Dr
- 31686 Luring Pines Dr
- 31492 Inspiration Dr
- 31713 Luring Pines Cir
- 31111 All View Dr
- 31194 Outer Highway 18 N
- 31349 Deer Lick Ln
- 2595 Sunset Dr
- 31162 All View Dr
- 31120 Mountain Oak Dr
- 31353 Marcella Dr
- 31489 Circle View Dr
- 31469 Circle View Dr
- 31457 Circle View Dr
- 31495 Circle View Dr
- 31484 Circle View Dr
- 31478 Circle View Dr
- 31464 Circle View Dr
- 31496 Circle View Dr
- 31482 Valley Ridge Dr
- 31482 Valley Ridge Rd
- 31449 Circle View Dr
- 31456 Circle View Dr
- 31500 Circle View Dr
- 31509 Circle View Dr
- 31441 Circle View Dr
- 31442 Valley Ridge Dr
- 31448 Circle View Dr
- 31442 Valley Ridge
- 31473 Onacrest Dr
- 31471 Valley Ridge Dr
Your Personal Tour Guide
Ask me questions while you tour the home.