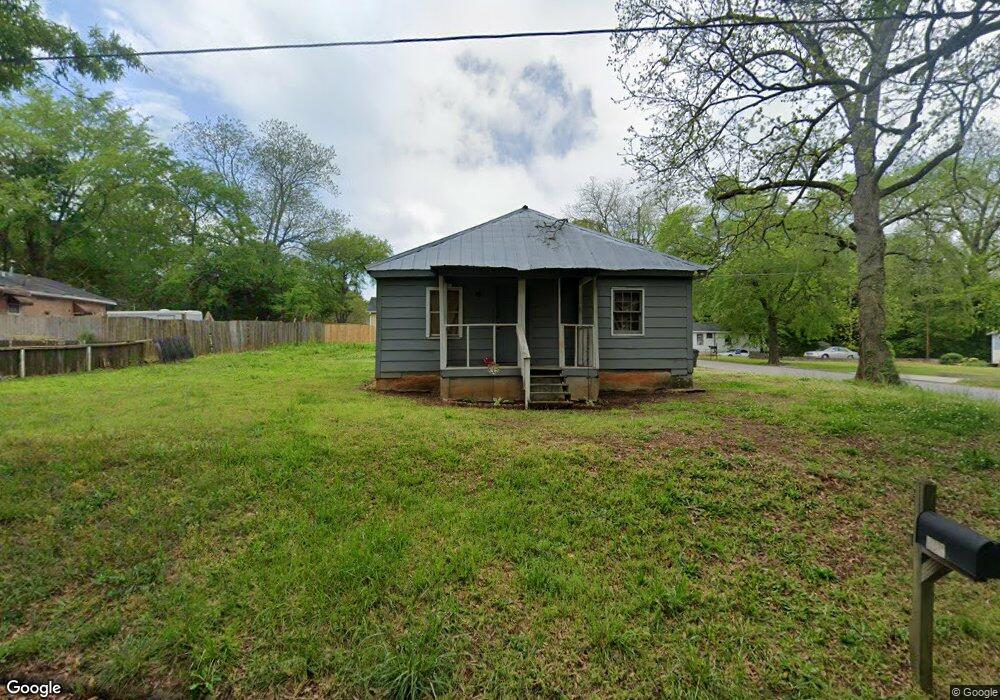
3149 Spring St NW Covington, GA 30014
Estimated Value: $76,000 - $136,000
--
Bed
1
Bath
756
Sq Ft
$146/Sq Ft
Est. Value
About This Home
This home is located at 3149 Spring St NW, Covington, GA 30014 and is currently estimated at $110,451, approximately $146 per square foot. 3149 Spring St NW is a home located in Newton County with nearby schools including Porterdale Elementary School, Clements Middle School, and Eastside High School.
Ownership History
Date
Name
Owned For
Owner Type
Purchase Details
Closed on
Mar 30, 2021
Sold by
Chanan Investment Grp Llc
Bought by
First Source Investments Llc
Current Estimated Value
Purchase Details
Closed on
Aug 19, 2020
Sold by
Ballard Thomas W
Bought by
Chanan Investment Grp Llc
Home Financials for this Owner
Home Financials are based on the most recent Mortgage that was taken out on this home.
Original Mortgage
$30,000
Interest Rate
3%
Mortgage Type
Commercial
Purchase Details
Closed on
Mar 2, 2010
Sold by
Ballard Thomas W
Bought by
Ballard Thomas W
Purchase Details
Closed on
Sep 20, 2007
Sold by
Ballard Thomas W
Bought by
Shoup Thomas
Home Financials for this Owner
Home Financials are based on the most recent Mortgage that was taken out on this home.
Original Mortgage
$35,000
Interest Rate
6.57%
Mortgage Type
Trade
Purchase Details
Closed on
Apr 18, 2007
Sold by
Sigman Const Co Inc
Bought by
Ballard Thomas W
Create a Home Valuation Report for This Property
The Home Valuation Report is an in-depth analysis detailing your home's value as well as a comparison with similar homes in the area
Home Values in the Area
Average Home Value in this Area
Purchase History
| Date | Buyer | Sale Price | Title Company |
|---|---|---|---|
| First Source Investments Llc | $52,000 | -- | |
| Chanan Investment Grp Llc | $40,000 | -- | |
| Ballard Thomas W | $15,000 | -- | |
| Shoup Thomas | $50,000 | -- | |
| Ballard Thomas W | $21,200 | -- |
Source: Public Records
Mortgage History
| Date | Status | Borrower | Loan Amount |
|---|---|---|---|
| Previous Owner | Chanan Investment Grp Llc | $30,000 | |
| Previous Owner | Shoup Thomas | $35,000 |
Source: Public Records
Tax History Compared to Growth
Tax History
| Year | Tax Paid | Tax Assessment Tax Assessment Total Assessment is a certain percentage of the fair market value that is determined by local assessors to be the total taxable value of land and additions on the property. | Land | Improvement |
|---|---|---|---|---|
| 2024 | $1,080 | $35,760 | $8,400 | $27,360 |
| 2023 | $742 | $22,840 | $4,000 | $18,840 |
| 2022 | $676 | $18,400 | $4,000 | $14,400 |
| 2021 | $545 | $15,000 | $6,800 | $8,200 |
| 2020 | $515 | $12,920 | $6,800 | $6,120 |
| 2019 | $504 | $12,400 | $6,800 | $5,600 |
| 2018 | $321 | $7,800 | $4,800 | $3,000 |
| 2017 | $256 | $6,240 | $3,600 | $2,640 |
| 2016 | $271 | $6,600 | $2,800 | $3,800 |
| 2015 | $301 | $7,320 | $2,000 | $5,320 |
| 2014 | $160 | $7,680 | $0 | $0 |
Source: Public Records
Map
Nearby Homes
- 13709 Whitman Ln
- 0 S Highway 81 Unit 10621341
- 0 Old Covered Bridge Rd Unit 10618938
- 13806 Homer Ln
- 4689 Sunrise Ridge
- 4561 Sunrise Ridge
- 4457 Sunrise Ridge
- 4485 Sunrise Ridge
- 4471 Sunrise Ridge
- 4645 Sunrise Ridge
- 4773 Foxhollow Trail
- 4629 Sunrise Ridge
- 4760 Foxhollow Trail
- 4654 Sunrise Ridge
- 4664 Sunrise Ridge
- 4764 Foxhollow Trail
- 4105 Washington St SW
- 4124 Hunt St SW
- 5135 Arnold St
- 5102 Park St SW
- 3113 Bohannon St NW
- 3139 Spring St NW
- 3119 Bohannon St NW
- 3133 Corley St NW
- 3110 Bohannon St NW
- 3123 Bohannon St NW
- 3132 Spring St NW
- 3152 Corley St NW
- 3120 Bohannon St NW
- 0 Corley St NW Unit 7492065
- 3127 Bohannon St NW
- 3126 Corley St NW
- 3126 Bohannon St NW
- 3133 Stone Mountain St NW
- 3133 Bohannon St NW
- 3160 Corley St NW
- 3127 Stone Mountain St NW
- 3153 Corley St NW
- 3120 Corley St NW
- 3130 Bohannon St NW