315 Blackthorn Rd Marstons Mills, MA 02648
Marstons Mills NeighborhoodEstimated payment $4,227/month
Highlights
- Medical Services
- Wood Flooring
- 1 Car Attached Garage
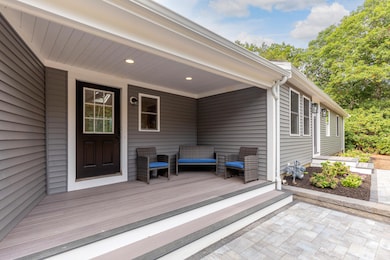
- Deck
- No HOA
- Property is near shops
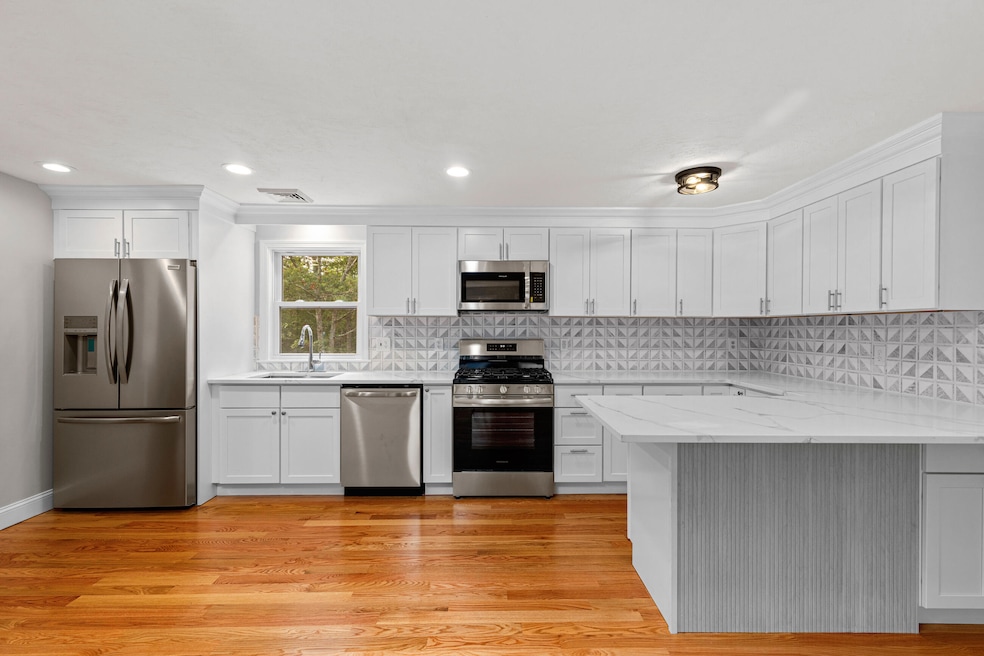
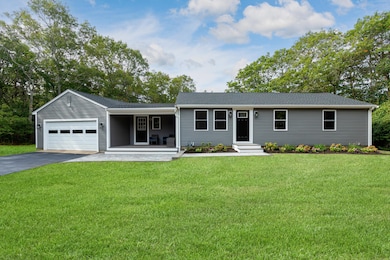
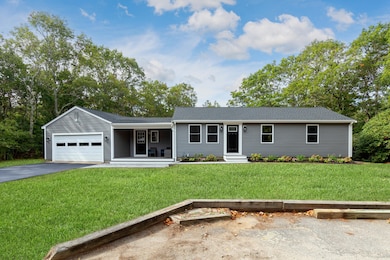
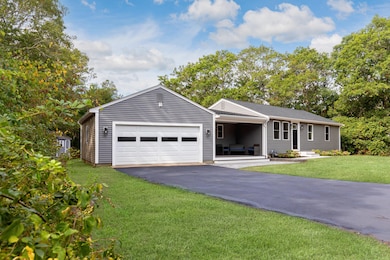
About This Home
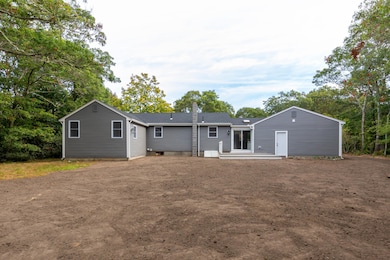
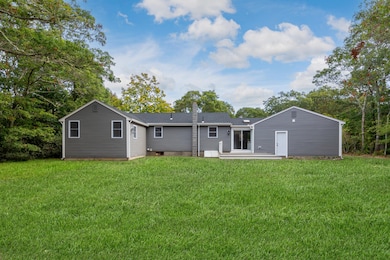
Completely renovated three-bedroom, two-bath home in desirable Marstons Mills. This turnkey open floor plan property features a brand NEW kitchen with NEW Frigidaire appliances, NEW cabinetry, quartz countertops and custom backsplash. There are gleaming NEW hardwood floors thoughout . 2 brand NEW tiled bathrooms, including one in the oversized master suite. There is plenty of space to spread out with two separate sitting areas, a NEW deck in the back yard and a NEW farmers porch in the front. There is brand NEW heating and central AC throughout the home as well as a NEW gas hot water heater. Also NEW are the roof, siding with Azec trim, windows, NEW gutters with leaf guard and septic system. Even the lawn is NEW! Do not miss this opportunity in Marstons Mills.
Home Details
Home Type
- Single Family
Est. Annual Taxes
- $2,666
Year Built
- Built in 1980 | Remodeled
Lot Details
- 0.46 Acre Lot
- Level Lot
- Property is zoned RF
Parking
- 1 Car Attached Garage
Home Design
- Poured Concrete
- Asphalt Roof
Interior Spaces
- 1,416 Sq Ft Home
- 1-Story Property
- Basement Fills Entire Space Under The House
Flooring
- Wood
- Tile
Bedrooms and Bathrooms
- 3 Bedrooms
- 2 Full Bathrooms
Outdoor Features
- Deck
Location
- Property is near place of worship
- Property is near shops
- Property is near a golf course
Utilities
- Central Air
- Heating Available
- Gas Water Heater
- Septic Tank
Listing and Financial Details
- Assessor Parcel Number 032012
Community Details
Overview
- No Home Owners Association
- Near Conservation Area
Amenities
- Medical Services
Map
Home Values in the Area
Average Home Value in this Area
Tax History
| Year | Tax Paid | Tax Assessment Tax Assessment Total Assessment is a certain percentage of the fair market value that is determined by local assessors to be the total taxable value of land and additions on the property. | Land | Improvement |
|---|---|---|---|---|
| 2025 | $4,229 | $522,700 | $155,900 | $366,800 |
| 2024 | $4,046 | $518,000 | $155,900 | $362,100 |
| 2023 | $3,779 | $453,100 | $141,700 | $311,400 |
| 2022 | $3,633 | $376,900 | $105,000 | $271,900 |
| 2021 | $2,765 | $328,200 | $105,000 | $223,200 |
| 2020 | $1,652 | $322,700 | $105,000 | $217,700 |
| 2019 | $2,674 | $295,900 | $105,000 | $190,900 |
| 2018 | $20 | $271,000 | $110,500 | $160,500 |
| 2017 | $2,829 | $262,900 | $110,500 | $152,400 |
| 2016 | $2,877 | $263,900 | $111,500 | $152,400 |
| 2015 | $2,758 | $254,200 | $109,000 | $145,200 |
Property History
| Date | Event | Price | List to Sale | Price per Sq Ft |
|---|---|---|---|---|
| 10/17/2025 10/17/25 | Price Changed | $759,900 | -3.7% | $537 / Sq Ft |
| 10/07/2025 10/07/25 | Price Changed | $789,000 | -1.3% | $557 / Sq Ft |
| 08/26/2025 08/26/25 | For Sale | $799,000 | -- | $564 / Sq Ft |
Purchase History
| Date | Type | Sale Price | Title Company |
|---|---|---|---|
| Fiduciary Deed | $405,000 | None Available | |
| Fiduciary Deed | $405,000 | None Available |
Source: Cape Cod & Islands Association of REALTORS®
MLS Number: 22504147
APN: MMIL-000032-000000-000012
Disclaimer: Certain information contained herein is derived from information provided by parties other than Homes.com. All information provided is deemed reliable, but is not guaranteed to be accurate and should be independently verified.
![]() All data relating to real estate for sale on this page comes from the Broker Reciprocity (BR) of the Cape Cod & Islands Multiple Listing Service, Inc. Detailed information about real estate listings held by brokerage firms other than CC&I Assoc. of REALTORS®, Inc. includes the name of the listing company. Neither the listing company nor CC&I Assoc. of REALTORS®, Inc. shall be responsible for any typographical errors, misinformation, misprints and shall be held totally harmless. The Broker providing this data believes it to be correct, but advises interested parties to confirm any item before relying on it in a purchase decision. All properties are subject to prior sale, changes, or withdrawal. Copyright 2025 © Cape Cod & Islands Multiple Listing Service, Inc. All rights reserved.
All data relating to real estate for sale on this page comes from the Broker Reciprocity (BR) of the Cape Cod & Islands Multiple Listing Service, Inc. Detailed information about real estate listings held by brokerage firms other than CC&I Assoc. of REALTORS®, Inc. includes the name of the listing company. Neither the listing company nor CC&I Assoc. of REALTORS®, Inc. shall be responsible for any typographical errors, misinformation, misprints and shall be held totally harmless. The Broker providing this data believes it to be correct, but advises interested parties to confirm any item before relying on it in a purchase decision. All properties are subject to prior sale, changes, or withdrawal. Copyright 2025 © Cape Cod & Islands Multiple Listing Service, Inc. All rights reserved.
- 18 Sandy Valley Rd
- 19 Westerly Dr
- 5 Anthonys Way
- 89 Eisenhower Dr
- 766 Putnam Ave
- 20 Brigantine Ave
- 50 Hane Rd
- 5 Andersen Ave
- 70 Cape Dr Unit 4C
- 35 Ashumet Rd Unit 6C
- 1131 Old Stage Rd
- 422 Massachusetts 6a Unit 2
- 310 White Oak Trail Unit B
- 310 White Oak Trail
- 101 Longfellow Dr
- 35 Ocean View Ave
- 31 Robbins St
- 14 Pga Ln
- 1413 Falmouth Rd
- 69 Joan Rd
