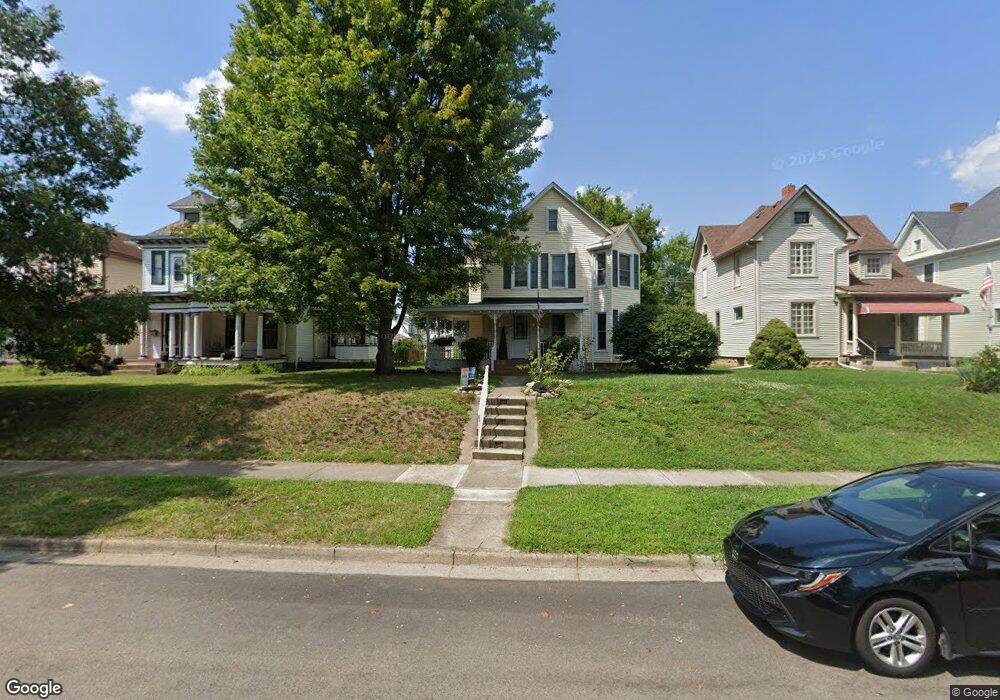
315 E Main St West Carrollton, OH 45449
Estimated Value: $172,000 - $217,000
3
Beds
1
Bath
1,678
Sq Ft
$114/Sq Ft
Est. Value
About This Home
This home is located at 315 E Main St, West Carrollton, OH 45449 and is currently estimated at $190,707, approximately $113 per square foot. 315 E Main St is a home located in Montgomery County with nearby schools including West Carrollton High School, Miami Valley Academies, and Bishop Leibold School.
Ownership History
Date
Name
Owned For
Owner Type
Purchase Details
Closed on
Aug 8, 2005
Sold by
Jordan Lee Jean
Bought by
Hollingsworth Stephen D and Hollingsworth Dawn R
Current Estimated Value
Home Financials for this Owner
Home Financials are based on the most recent Mortgage that was taken out on this home.
Original Mortgage
$108,000
Outstanding Balance
$56,916
Interest Rate
5.71%
Mortgage Type
Fannie Mae Freddie Mac
Estimated Equity
$133,791
Purchase Details
Closed on
Dec 19, 2001
Sold by
Ryan Barker Terry
Bought by
Jordan Lee Jean
Home Financials for this Owner
Home Financials are based on the most recent Mortgage that was taken out on this home.
Original Mortgage
$90,000
Interest Rate
6.53%
Purchase Details
Closed on
Jul 25, 2000
Sold by
Gibson Jada
Bought by
Barker Terry Ryan
Purchase Details
Closed on
May 15, 1995
Sold by
Barker Sherry E
Bought by
Barker Terry Ryan and Gibson Jada
Create a Home Valuation Report for This Property
The Home Valuation Report is an in-depth analysis detailing your home's value as well as a comparison with similar homes in the area
Home Values in the Area
Average Home Value in this Area
Purchase History
| Date | Buyer | Sale Price | Title Company |
|---|---|---|---|
| Hollingsworth Stephen D | $120,000 | Hallmark Title Agency Inc | |
| Jordan Lee Jean | $100,000 | Landmark Title Agency Inc | |
| Barker Terry Ryan | -- | -- | |
| Barker Terry Ryan | -- | -- |
Source: Public Records
Mortgage History
| Date | Status | Borrower | Loan Amount |
|---|---|---|---|
| Open | Hollingsworth Stephen D | $108,000 | |
| Previous Owner | Jordan Lee Jean | $90,000 |
Source: Public Records
Tax History Compared to Growth
Tax History
| Year | Tax Paid | Tax Assessment Tax Assessment Total Assessment is a certain percentage of the fair market value that is determined by local assessors to be the total taxable value of land and additions on the property. | Land | Improvement |
|---|---|---|---|---|
| 2024 | $3,038 | $47,710 | $6,650 | $41,060 |
| 2023 | $3,038 | $47,710 | $6,650 | $41,060 |
| 2022 | $2,749 | $33,630 | $4,680 | $28,950 |
| 2021 | $2,754 | $33,630 | $4,680 | $28,950 |
| 2020 | $2,754 | $33,630 | $4,680 | $28,950 |
| 2019 | $2,516 | $28,180 | $4,250 | $23,930 |
| 2018 | $2,365 | $28,180 | $4,250 | $23,930 |
| 2017 | $2,304 | $28,180 | $4,250 | $23,930 |
| 2016 | $2,303 | $27,500 | $4,250 | $23,250 |
| 2015 | $2,123 | $27,500 | $4,250 | $23,250 |
| 2014 | $2,123 | $27,500 | $4,250 | $23,250 |
| 2012 | -- | $32,960 | $5,550 | $27,410 |
Source: Public Records
Map
Nearby Homes
- 322 E Main St
- 109 Cedar St
- 305 E Central Ave
- 341 E Central Ave
- 137 E Central Ave
- 333 E Cottage Ave
- 428 E Cottage Ave
- 209 E Cottage Ave
- 434 E Cottage Ave
- 428 Burns Ave
- 12 E Main St
- 21 W Main St
- 201 S Smith St
- 2 Savoy Ave
- 518 Regal Ave
- 509 Windsor Ave
- 133 E Circle Dr
- 949 Primrose Dr
- 26 Southard Ln
- 64 Airstream Dr