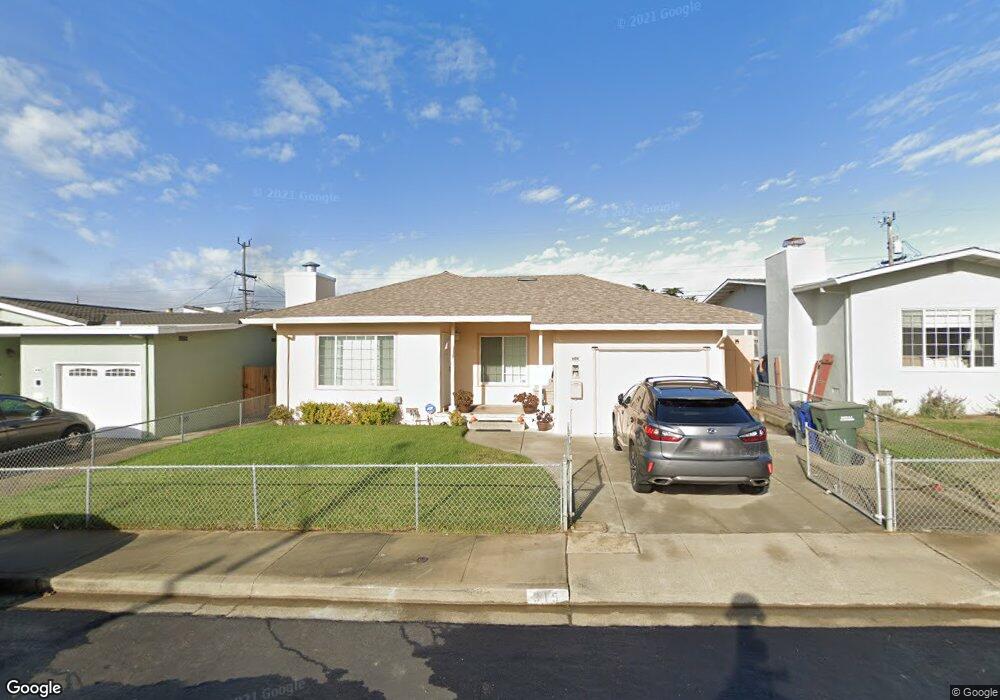
315 Forest View Dr South San Francisco, CA 94080
Sunshine Gardens NeighborhoodEstimated Value: $1,161,000 - $1,273,000
3
Beds
1
Bath
1,000
Sq Ft
$1,201/Sq Ft
Est. Value
About This Home
This home is located at 315 Forest View Dr, South San Francisco, CA 94080 and is currently estimated at $1,200,973, approximately $1,200 per square foot. 315 Forest View Dr is a home located in San Mateo County with nearby schools including Sunshine Gardens Elementary School, Parkway Heights Middle School, and El Camino High School.
Ownership History
Date
Name
Owned For
Owner Type
Purchase Details
Closed on
May 17, 2016
Sold by
Cheng Carol
Bought by
Cheng Carol and Vuong Hieu Binh
Current Estimated Value
Purchase Details
Closed on
Oct 21, 2008
Sold by
Vuong Hieu Binh
Bought by
Cheng Carol
Purchase Details
Closed on
Oct 4, 2006
Sold by
Cheng Carol and Vuong Hieu Binh
Bought by
Vuong Hieu Binh and Cheng Carol
Home Financials for this Owner
Home Financials are based on the most recent Mortgage that was taken out on this home.
Original Mortgage
$542,250
Outstanding Balance
$326,423
Interest Rate
6.62%
Mortgage Type
Purchase Money Mortgage
Estimated Equity
$874,550
Purchase Details
Closed on
Dec 2, 2005
Sold by
Hranuelli Ann M and Carrillo Alexander J
Bought by
Cheng Carol and Vuong Hieu Binh
Home Financials for this Owner
Home Financials are based on the most recent Mortgage that was taken out on this home.
Original Mortgage
$54,500
Interest Rate
5.68%
Mortgage Type
Stand Alone Second
Create a Home Valuation Report for This Property
The Home Valuation Report is an in-depth analysis detailing your home's value as well as a comparison with similar homes in the area
Home Values in the Area
Average Home Value in this Area
Purchase History
| Date | Buyer | Sale Price | Title Company |
|---|---|---|---|
| Cheng Carol | -- | None Available | |
| Cheng Carol | -- | None Available | |
| Vuong Hieu Binh | -- | Fidelity National Title Co | |
| Cheng Carol | $550,000 | Fidelity National Title |
Source: Public Records
Mortgage History
| Date | Status | Borrower | Loan Amount |
|---|---|---|---|
| Open | Vuong Hieu Binh | $542,250 | |
| Closed | Cheng Carol | $54,500 | |
| Closed | Cheng Carol | $440,000 |
Source: Public Records
Tax History Compared to Growth
Tax History
| Year | Tax Paid | Tax Assessment Tax Assessment Total Assessment is a certain percentage of the fair market value that is determined by local assessors to be the total taxable value of land and additions on the property. | Land | Improvement |
|---|---|---|---|---|
| 2025 | $11,181 | $986,204 | $375,802 | $610,402 |
| 2023 | $11,181 | $827,420 | $361,210 | $466,210 |
| 2022 | $9,281 | $813,256 | $354,128 | $459,128 |
| 2021 | $8,071 | $694,370 | $347,185 | $347,185 |
| 2020 | $7,971 | $687,252 | $343,626 | $343,626 |
| 2019 | $7,885 | $673,778 | $336,889 | $336,889 |
| 2018 | $7,696 | $660,568 | $330,284 | $330,284 |
| 2017 | $7,501 | $647,616 | $323,808 | $323,808 |
| 2016 | $7,348 | $634,918 | $317,459 | $317,459 |
| 2015 | $7,229 | $625,382 | $312,691 | $312,691 |
| 2014 | $7,073 | $613,132 | $306,566 | $306,566 |
Source: Public Records
Map
Nearby Homes
- 252 Sequoia Ave
- 467 Holly Ave
- 829 Stonegate Dr
- 1488 El Camino Real Unit 211
- 889 Mclellan Dr Unit 205
- 889 Mclellan Dr Unit 302
- 728 Cottonwood Ave
- 729 Grand Ave
- 0 Indio Dr
- 719 Circle Ct
- 645 Baden Ave Unit 4
- 69 Windcrest Ln
- 121 Northcrest Dr
- 632 1st Ln
- 311 Magnolia Ave
- 577 Miller Ave
- 1700 El Camino Real Unit 2-03
- 1700 El Camino Real
- 573 Miller Ave
- 556 Keoncrest Dr
- 317 Forest View Dr
- 311 Forest View Dr
- 304 Heather Way
- 321 Forest View Dr
- 307 Forest View Dr
- 308 Heather Way
- 300 Heather Way
- 312 Heather Way
- 325 Forest View Dr
- 1124 Miller Ave
- 316 Forest View Dr
- 1114 Miller Ave
- 312 Forest View Dr
- 318 Forest View Dr
- 316 Heather Way
- 308 Forest View Dr
- 329 Forest View Dr
- 1104 Miller Ave
- 304 Forest View Dr