
Seller's Agent in 2025
Kerry Ellison
Keller Williams Realty
(501) 725-1227
9 in this area
556 Total Sales
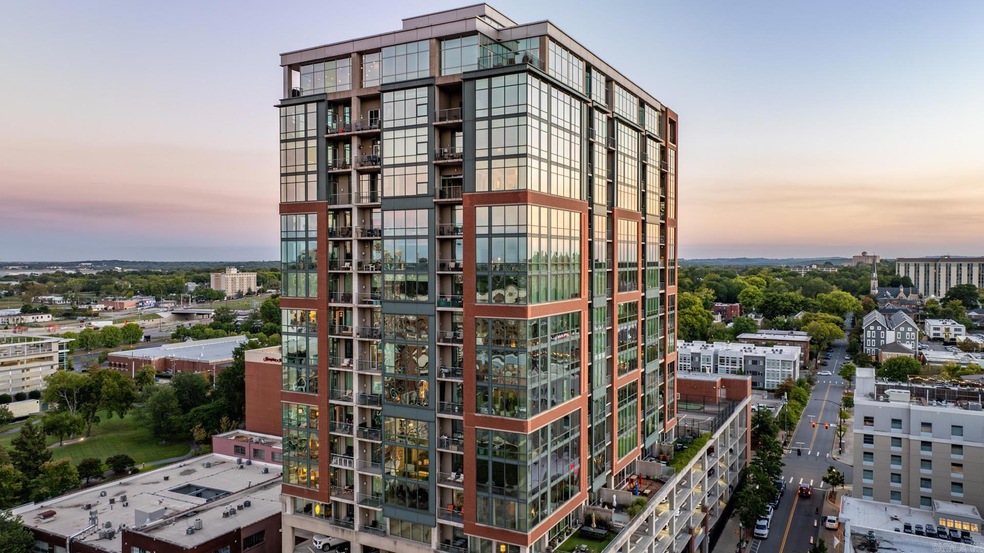
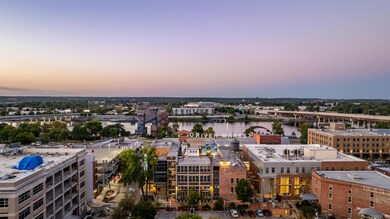
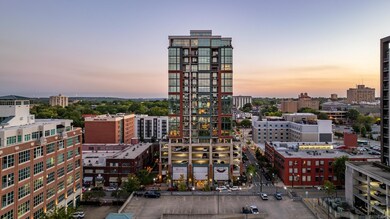
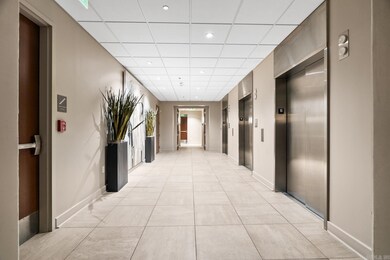
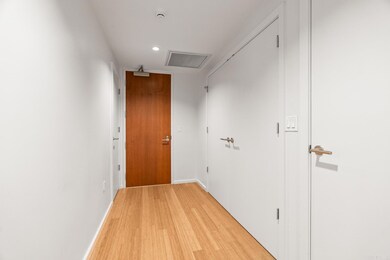
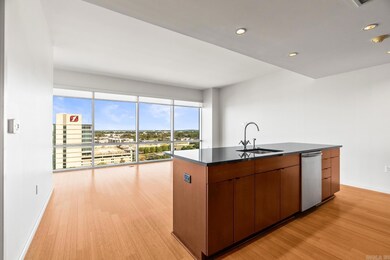
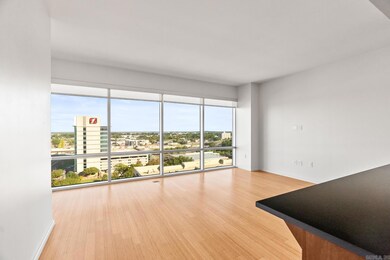
Spectacular downtown Little Rock condo with amazing city and river views. Fabulous floor plan for easy living! Located in the Heart of Downtown and close to everything from shopping, fine dining, business to entertainment along with easy access to UAMS/Childrens and the airport. Fabulous gourmet kitchen and spacious living with private balcony terrace. Relaxing primary suite with luxurious bath. Fantastic amenities such as swimming pool, fitness center, tennis, basketball courts, rooftop deck and large entertainment room along with concierge service and reserved parking! A very special opportunity at an excellent value.
| Date | Event | Price | Change | Sq Ft Price |
|---|---|---|---|---|
| 08/19/2025 08/19/25 | For Sale | $395,000 | +26.6% | $290 / Sq Ft |
| 08/12/2025 08/12/25 | Price Changed | $312,000 | -2.5% | $253 / Sq Ft |
| 08/07/2025 08/07/25 | Sold | $320,000 | 0.0% | $195 / Sq Ft |
| 07/03/2025 07/03/25 | For Sale | $320,000 | -12.3% | $259 / Sq Ft |
| 06/06/2025 06/06/25 | Price Changed | $365,000 | -8.5% | $222 / Sq Ft |
| 05/09/2025 05/09/25 | For Sale | $399,000 | -5.0% | $243 / Sq Ft |
| 04/30/2025 04/30/25 | Sold | $420,000 | -39.9% | $269 / Sq Ft |
| 03/07/2025 03/07/25 | Sold | $699,000 | +64.5% | $370 / Sq Ft |
| 02/17/2025 02/17/25 | Pending | -- | -- | -- |
| 02/15/2025 02/15/25 | Pending | -- | -- | -- |
| 02/05/2025 02/05/25 | For Sale | $425,000 | -60.5% | $272 / Sq Ft |
| 02/03/2025 02/03/25 | Sold | $1,075,000 | +48.3% | $364 / Sq Ft |
| 01/13/2025 01/13/25 | Price Changed | $724,900 | +190.0% | $384 / Sq Ft |
| 01/06/2025 01/06/25 | Sold | $250,000 | -27.5% | $256 / Sq Ft |
| 12/23/2024 12/23/24 | Sold | $345,000 | +38.0% | $280 / Sq Ft |
| 12/03/2024 12/03/24 | Sold | $250,000 | -27.5% | $304 / Sq Ft |
| 11/25/2024 11/25/24 | Pending | -- | -- | -- |
| 11/22/2024 11/22/24 | Pending | -- | -- | -- |
| 11/20/2024 11/20/24 | For Sale | $345,000 | -23.3% | $280 / Sq Ft |
| 11/12/2024 11/12/24 | Sold | $450,000 | -40.0% | $365 / Sq Ft |
| 11/06/2024 11/06/24 | Price Changed | $749,900 | +183.0% | $397 / Sq Ft |
| 11/05/2024 11/05/24 | Pending | -- | -- | -- |
| 10/08/2024 10/08/24 | For Sale | $265,000 | -78.8% | $272 / Sq Ft |
| 10/08/2024 10/08/24 | For Sale | $1,250,000 | +177.8% | $423 / Sq Ft |
| 10/02/2024 10/02/24 | Pending | -- | -- | -- |
| 10/01/2024 10/01/24 | For Sale | $450,000 | -9.8% | $365 / Sq Ft |
| 09/27/2024 09/27/24 | Sold | $499,000 | -36.4% | $350 / Sq Ft |
| 09/22/2024 09/22/24 | Pending | -- | -- | -- |
| 09/11/2024 09/11/24 | For Sale | $784,500 | +127.4% | $415 / Sq Ft |
| 08/26/2024 08/26/24 | Sold | $345,000 | -30.9% | $254 / Sq Ft |
| 08/06/2024 08/06/24 | Pending | -- | -- | -- |
| 07/30/2024 07/30/24 | Pending | -- | -- | -- |
| 07/29/2024 07/29/24 | Price Changed | $499,000 | -5.0% | $350 / Sq Ft |
| 07/11/2024 07/11/24 | For Sale | $525,000 | +110.0% | $368 / Sq Ft |
| 06/03/2024 06/03/24 | For Sale | $250,000 | -26.4% | $304 / Sq Ft |
| 05/08/2024 05/08/24 | Price Changed | $339,900 | +4.9% | $250 / Sq Ft |
| 03/27/2024 03/27/24 | Sold | $324,000 | -7.4% | $324 / Sq Ft |
| 03/27/2024 03/27/24 | For Sale | $349,900 | +6.4% | $258 / Sq Ft |
| 02/18/2024 02/18/24 | Pending | -- | -- | -- |
| 12/28/2023 12/28/23 | Price Changed | $329,000 | -4.4% | $329 / Sq Ft |
| 12/12/2023 12/12/23 | Price Changed | $344,000 | 0.0% | $344 / Sq Ft |
| 12/01/2023 12/01/23 | Rented | $1,600 | 0.0% | -- |
| 11/16/2023 11/16/23 | For Sale | $359,000 | 0.0% | $359 / Sq Ft |
| 10/11/2023 10/11/23 | Price Changed | $1,600 | 0.0% | $2 / Sq Ft |
| 09/29/2023 09/29/23 | Sold | $425,000 | 0.0% | $272 / Sq Ft |
| 09/29/2023 09/29/23 | Pending | -- | -- | -- |
| 09/12/2023 09/12/23 | Off Market | $425,000 | -- | -- |
| 08/28/2023 08/28/23 | Sold | $455,000 | +1.1% | $291 / Sq Ft |
| 08/11/2023 08/11/23 | For Sale | $449,900 | +5.9% | $288 / Sq Ft |
| 08/11/2023 08/11/23 | Off Market | $425,000 | -- | -- |
| 06/30/2023 06/30/23 | Rented | $1,650 | -13.2% | -- |
| 06/28/2023 06/28/23 | Price Changed | $1,900 | 0.0% | $2 / Sq Ft |
| 06/28/2023 06/28/23 | Price Changed | $449,900 | -5.3% | $288 / Sq Ft |
| 06/27/2023 06/27/23 | For Sale | $475,000 | 0.0% | $304 / Sq Ft |
| 06/02/2023 06/02/23 | For Rent | $2,000 | 0.0% | -- |
| 05/12/2023 05/12/23 | For Sale | $479,900 | -63.1% | $307 / Sq Ft |
| 03/02/2023 03/02/23 | Sold | $1,300,000 | +188.9% | $371 / Sq Ft |
| 02/28/2023 02/28/23 | Sold | $450,000 | -36.2% | $289 / Sq Ft |
| 02/23/2023 02/23/23 | Pending | -- | -- | -- |
| 02/14/2023 02/14/23 | Pending | -- | -- | -- |
| 12/27/2022 12/27/22 | Sold | $705,000 | -4.6% | $333 / Sq Ft |
| 11/01/2022 11/01/22 | For Sale | $739,000 | -45.3% | $349 / Sq Ft |
| 10/25/2022 10/25/22 | Price Changed | $1,350,000 | +285.7% | $385 / Sq Ft |
| 09/30/2022 09/30/22 | Pending | -- | -- | -- |
| 09/26/2022 09/26/22 | Sold | $350,000 | -29.3% | $257 / Sq Ft |
| 08/23/2022 08/23/22 | For Sale | $495,000 | 0.0% | $318 / Sq Ft |
| 08/14/2022 08/14/22 | Rented | $2,100,000 | +104900.0% | -- |
| 08/12/2022 08/12/22 | Rented | $2,000 | 0.0% | -- |
| 08/11/2022 08/11/22 | Sold | $208,000 | -60.7% | $275 / Sq Ft |
| 08/04/2022 08/04/22 | Sold | $529,000 | +46.9% | $382 / Sq Ft |
| 08/04/2022 08/04/22 | Pending | -- | -- | -- |
| 07/27/2022 07/27/22 | Price Changed | $360,000 | +38.5% | $264 / Sq Ft |
| 07/27/2022 07/27/22 | For Sale | $260,000 | +25.0% | $191 / Sq Ft |
| 07/15/2022 07/15/22 | For Sale | $208,000 | -44.5% | $275 / Sq Ft |
| 07/07/2022 07/07/22 | Sold | $375,000 | -10.5% | $240 / Sq Ft |
| 07/07/2022 07/07/22 | Pending | -- | -- | -- |
| 07/01/2022 07/01/22 | Sold | $419,000 | -23.8% | $308 / Sq Ft |
| 05/24/2022 05/24/22 | For Sale | $549,900 | 0.0% | $397 / Sq Ft |
| 05/24/2022 05/24/22 | For Rent | $2,000 | 0.0% | -- |
| 05/13/2022 05/13/22 | Sold | $450,000 | -3.2% | $450 / Sq Ft |
| 05/13/2022 05/13/22 | Price Changed | $465,000 | -68.9% | $341 / Sq Ft |
| 05/04/2022 05/04/22 | For Sale | $1,495,000 | +211.5% | $427 / Sq Ft |
| 04/20/2022 04/20/22 | For Sale | $480,000 | +20.0% | $352 / Sq Ft |
| 03/29/2022 03/29/22 | Sold | $400,000 | 0.0% | $324 / Sq Ft |
| 03/29/2022 03/29/22 | Sold | $400,000 | -3.6% | $324 / Sq Ft |
| 03/21/2022 03/21/22 | Pending | -- | -- | -- |
| 03/15/2022 03/15/22 | For Sale | $415,000 | +3.8% | $336 / Sq Ft |
| 03/15/2022 03/15/22 | Off Market | $400,000 | -- | -- |
| 02/23/2022 02/23/22 | Pending | -- | -- | -- |
| 02/23/2022 02/23/22 | For Sale | $415,000 | 0.0% | $336 / Sq Ft |
| 02/17/2022 02/17/22 | Price Changed | $2,500 | -7.4% | $2 / Sq Ft |
| 02/07/2022 02/07/22 | For Rent | $2,700 | 0.0% | -- |
| 02/04/2022 02/04/22 | For Sale | $450,000 | +77.2% | $450 / Sq Ft |
| 12/15/2021 12/15/21 | Pending | -- | -- | -- |
| 12/13/2021 12/13/21 | Sold | $254,000 | -66.1% | $309 / Sq Ft |
| 12/10/2021 12/10/21 | Sold | $749,000 | +80.5% | $315 / Sq Ft |
| 12/08/2021 12/08/21 | For Sale | $415,000 | -11.3% | $336 / Sq Ft |
| 12/01/2021 12/01/21 | Sold | $468,000 | +80.7% | $337 / Sq Ft |
| 11/29/2021 11/29/21 | Pending | -- | -- | -- |
| 11/10/2021 11/10/21 | Pending | -- | -- | -- |
| 11/01/2021 11/01/21 | For Sale | $259,000 | -22.6% | $315 / Sq Ft |
| 10/03/2021 10/03/21 | Pending | -- | -- | -- |
| 09/30/2021 09/30/21 | Sold | $334,500 | -1.6% | $271 / Sq Ft |
| 09/14/2021 09/14/21 | For Sale | $339,900 | -30.6% | $275 / Sq Ft |
| 07/14/2021 07/14/21 | For Sale | $490,000 | 0.0% | $353 / Sq Ft |
| 06/28/2021 06/28/21 | Sold | $490,000 | +22.8% | $313 / Sq Ft |
| 06/25/2021 06/25/21 | For Sale | $399,000 | -19.5% | $255 / Sq Ft |
| 06/01/2021 06/01/21 | For Sale | $495,500 | 0.0% | $317 / Sq Ft |
| 05/06/2021 05/06/21 | For Rent | $1,650 | -52.9% | -- |
| 04/15/2021 04/15/21 | Rented | $3,500 | 0.0% | -- |
| 03/19/2021 03/19/21 | For Rent | $3,500 | 0.0% | -- |
| 02/01/2021 02/01/21 | For Sale | $749,000 | +102.5% | $315 / Sq Ft |
| 08/03/2020 08/03/20 | Sold | $369,900 | 0.0% | $272 / Sq Ft |
| 06/22/2020 06/22/20 | For Sale | $369,900 | -26.0% | $272 / Sq Ft |
| 04/15/2020 04/15/20 | Sold | $500,000 | -3.8% | $320 / Sq Ft |
| 02/10/2020 02/10/20 | For Sale | $519,900 | -31.7% | $333 / Sq Ft |
| 01/07/2020 01/07/20 | Sold | $761,280 | +164.8% | $320 / Sq Ft |
| 12/04/2019 12/04/19 | Sold | $287,500 | 0.0% | $288 / Sq Ft |
| 11/04/2019 11/04/19 | Pending | -- | -- | -- |
| 10/29/2019 10/29/19 | For Sale | $287,500 | -23.3% | $288 / Sq Ft |
| 10/01/2019 10/01/19 | Pending | -- | -- | -- |
| 09/30/2019 09/30/19 | Sold | $375,000 | -52.2% | $240 / Sq Ft |
| 09/05/2019 09/05/19 | Price Changed | $785,000 | +121.8% | $330 / Sq Ft |
| 08/06/2019 08/06/19 | Sold | $354,000 | -55.5% | $261 / Sq Ft |
| 07/11/2019 07/11/19 | For Sale | $795,000 | +263.8% | $334 / Sq Ft |
| 06/21/2019 06/21/19 | Sold | $218,500 | -43.8% | $265 / Sq Ft |
| 06/07/2019 06/07/19 | Price Changed | $389,000 | +78.0% | $249 / Sq Ft |
| 05/22/2019 05/22/19 | Pending | -- | -- | -- |
| 05/12/2019 05/12/19 | For Sale | $218,500 | 0.0% | $265 / Sq Ft |
| 05/01/2019 05/01/19 | Rented | $1,650 | -2.9% | -- |
| 04/09/2019 04/09/19 | For Rent | $1,700 | 0.0% | -- |
| 04/03/2019 04/03/19 | Price Changed | $399,000 | +10.4% | $255 / Sq Ft |
| 03/17/2019 03/17/19 | Price Changed | $361,500 | -12.9% | $267 / Sq Ft |
| 01/19/2019 01/19/19 | Price Changed | $415,000 | -2.4% | $266 / Sq Ft |
| 12/19/2018 12/19/18 | Price Changed | $425,000 | -15.0% | $272 / Sq Ft |
| 12/14/2018 12/14/18 | Sold | $500,000 | +11.1% | $320 / Sq Ft |
| 11/06/2018 11/06/18 | For Sale | $450,000 | +23.6% | $288 / Sq Ft |
| 10/28/2018 10/28/18 | Price Changed | $364,000 | -29.9% | $269 / Sq Ft |
| 10/04/2018 10/04/18 | For Sale | $519,000 | +38.8% | $332 / Sq Ft |
| 09/19/2018 09/19/18 | For Sale | $374,000 | +25.1% | $276 / Sq Ft |
| 10/18/2017 10/18/17 | Sold | $299,000 | -28.0% | $242 / Sq Ft |
| 09/11/2017 09/11/17 | Pending | -- | -- | -- |
| 05/02/2016 05/02/16 | Sold | $415,000 | -66.8% | $267 / Sq Ft |
| 04/02/2016 04/02/16 | Pending | -- | -- | -- |
| 07/24/2015 07/24/15 | Sold | $1,250,000 | -28.6% | $313 / Sq Ft |
| 06/24/2015 06/24/15 | Pending | -- | -- | -- |
| 06/09/2015 06/09/15 | For Sale | $1,750,000 | +326.8% | $438 / Sq Ft |
| 05/31/2015 05/31/15 | Sold | $410,000 | -10.7% | $262 / Sq Ft |
| 05/01/2015 05/01/15 | Pending | -- | -- | -- |
| 04/08/2015 04/08/15 | For Sale | $459,000 | +4.6% | $295 / Sq Ft |
| 02/09/2015 02/09/15 | For Sale | $439,000 | +95.1% | $281 / Sq Ft |
| 08/01/2014 08/01/14 | Sold | $225,000 | -4.2% | $273 / Sq Ft |
| 07/02/2014 07/02/14 | Pending | -- | -- | -- |
| 04/24/2014 04/24/14 | For Sale | $234,900 | -9.5% | $285 / Sq Ft |
| 03/18/2013 03/18/13 | Sold | $259,500 | -7.2% | $260 / Sq Ft |
| 02/16/2013 02/16/13 | Pending | -- | -- | -- |
| 08/01/2012 08/01/12 | For Sale | $279,500 | -- | $280 / Sq Ft |
Seller's Agent in 2025
Kerry Ellison
Keller Williams Realty
(501) 725-1227
9 in this area
556 Total Sales
B
Seller's Agent in 2025
Bill Miller
Dillon Homes and Real Estate
(501) 920-6959
3 Total Sales
Seller's Agent in 2025
Robert Richardson
Crye-Leike
(501) 580-1808
9 in this area
159 Total Sales
Seller's Agent in 2025
Casey Jones
Janet Jones Company
(501) 944-8000
10 in this area
371 Total Sales
Seller's Agent in 2025
Brandy Harp
Jon Underhill Real Estate
(501) 580-4277
6 in this area
249 Total Sales
Buyer's Agent in 2025
Nancy Gregory
Keller Williams Realty
(501) 920-9190
2 in this area
6 Total Sales
Source: Cooperative Arkansas REALTORS® MLS
MLS Number: 24037052
Disclaimer: Certain information contained herein is derived from information provided by parties other than Homes.com. All information provided is deemed reliable, but is not guaranteed to be accurate and should be independently verified.
![]() IDX information is provided exclusively for personal, non-commercial use, and may not be used for any purpose other than to identify prospective properties consumers may be interested in purchasing.
IDX information is provided exclusively for personal, non-commercial use, and may not be used for any purpose other than to identify prospective properties consumers may be interested in purchasing.