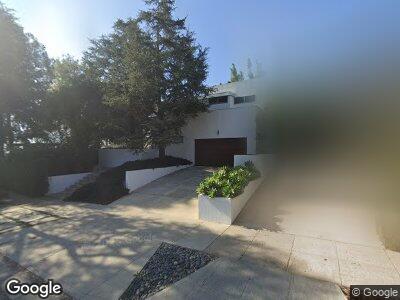
315 Via de la Paz Pacific Palisades, CA 90272
Estimated Value: $3,744,000 - $5,738,108
4
Beds
4
Baths
3,364
Sq Ft
$1,418/Sq Ft
Est. Value
About This Home
This home is located at 315 Via de la Paz, Pacific Palisades, CA 90272 and is currently estimated at $4,770,036, approximately $1,417 per square foot. 315 Via de la Paz is a home located in Los Angeles County with nearby schools including Palisades Charter Elementary, Marquez Charter School, and Paul Revere Charter Middle School.
Ownership History
Date
Name
Owned For
Owner Type
Purchase Details
Closed on
Feb 15, 2018
Sold by
Ayeroff Jeffrey and Longbine Marty
Bought by
Ayeroff Jeffrey Kent and Longbine Marty
Current Estimated Value
Home Financials for this Owner
Home Financials are based on the most recent Mortgage that was taken out on this home.
Original Mortgage
$1,000,000
Interest Rate
3.99%
Mortgage Type
New Conventional
Purchase Details
Closed on
Jun 30, 2008
Sold by
Ayeroff Jeffiey Kent and Longbine Marty
Bought by
Ayeroff Jeffrey and Longbine Marty
Purchase Details
Closed on
Dec 17, 1999
Sold by
Botnick Bruce and Botnick Marie
Bought by
Ayeroff Jeffrey Kent and Longbine Marty
Home Financials for this Owner
Home Financials are based on the most recent Mortgage that was taken out on this home.
Original Mortgage
$1,750,000
Interest Rate
7.83%
Create a Home Valuation Report for This Property
The Home Valuation Report is an in-depth analysis detailing your home's value as well as a comparison with similar homes in the area
Home Values in the Area
Average Home Value in this Area
Purchase History
| Date | Buyer | Sale Price | Title Company |
|---|---|---|---|
| Ayeroff Jeffrey Kent | -- | Westminster Title Company In | |
| Ayeroff Jeffrey | -- | None Available | |
| Ayeroff Jeffrey Kent | $2,500,000 | Southland Title |
Source: Public Records
Mortgage History
| Date | Status | Borrower | Loan Amount |
|---|---|---|---|
| Open | Ayeroff Jeffrey | $1,000,000 | |
| Closed | Ayeroff Jeffrey Kent | $1,000,000 | |
| Open | Ayeroff Jeffrey Kent | $1,967,000 | |
| Closed | Ayeroff Jeffrey Kent | $850,000 | |
| Closed | Ayeroff Jeffrey Kent | $200,000 | |
| Closed | Ayeroff Jeffrey Kent | $1,100,000 | |
| Closed | Ayeroff Jeffrey Kent | $1,750,000 |
Source: Public Records
Tax History Compared to Growth
Tax History
| Year | Tax Paid | Tax Assessment Tax Assessment Total Assessment is a certain percentage of the fair market value that is determined by local assessors to be the total taxable value of land and additions on the property. | Land | Improvement |
|---|---|---|---|---|
| 2024 | $46,965 | $3,882,982 | $3,013,699 | $869,283 |
| 2023 | $46,044 | $3,806,846 | $2,954,607 | $852,239 |
| 2022 | $43,883 | $3,732,203 | $2,896,674 | $835,529 |
| 2021 | $43,356 | $3,659,024 | $2,839,877 | $819,147 |
| 2019 | $42,044 | $3,550,497 | $2,755,646 | $794,851 |
| 2018 | $41,899 | $3,480,880 | $2,701,614 | $779,266 |
| 2016 | $40,092 | $3,345,715 | $2,596,708 | $749,007 |
| 2015 | $39,497 | $3,295,461 | $2,557,704 | $737,757 |
| 2014 | $39,606 | $3,230,909 | $2,507,603 | $723,306 |
Source: Public Records
Map
Nearby Homes
- 319 Via de la Paz
- 15419 Via de Las Olas
- 15515 Via de Las Olas
- 15519 Via de Las Olas
- 410 Via de la Paz
- 320 Mount Holyoke Ave
- 413 Swarthmore Ave
- 425 Swarthmore Ave
- 365 Mount Holyoke Ave
- 333 Lombard Ave
- 501 Via de la Paz
- 424 Lombard Ave
- 545 Swarthmore Ave
- 543 Radcliffe Ave
- 582 Radcliffe Ave
- 15257 De Pauw St
- 15225 De Pauw St
- 15461 De Pauw St
- 15229 De Pauw St
- 15321 De Pauw St
- 315 Via de la Paz
- 15413 Via de Las Olas
- 324 Beirut Ave
- 300 Via de la Paz
- 326 Beirut Ave
- 15425 Via de Las Olas
- 332 Beirut Ave
- 332 N Beirut Ave
- 331 Via de la Paz
- 338 Beirut Ave
- 318 Via de la Paz
- 324 Via de la Paz
- 344 Beirut Ave
- 337 Via de la Paz
- 15363 Via de Las Olas
- 15363 Vía de Las Olas
- 330 Via de la Paz
- 350 Beirut Ave
- 317 Beirut Ave
- 323 Beirut Ave