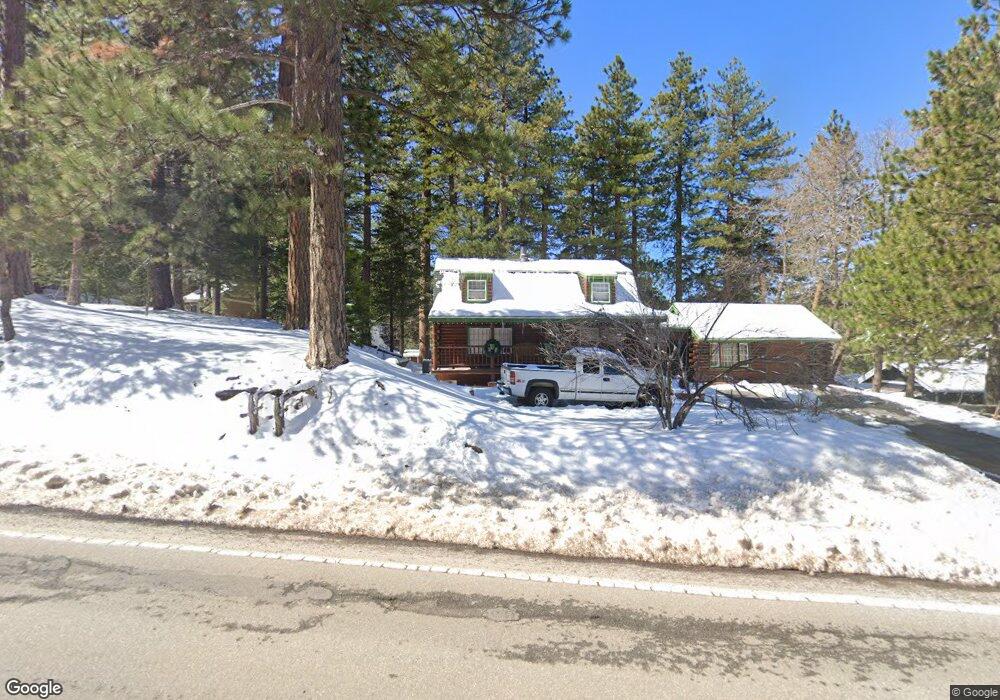
31515 Hilltop (Hwy 18) Running Springs, CA 92382
Estimated Value: $360,000 - $460,000
3
Beds
2
Baths
1,488
Sq Ft
$274/Sq Ft
Est. Value
About This Home
This home is located at 31515 Hilltop (Hwy 18), Running Springs, CA 92382 and is currently estimated at $407,202, approximately $273 per square foot. 31515 Hilltop (Hwy 18) is a home located in San Bernardino County with nearby schools including Charles Hoffman Elementary School, Mary P. Henck Intermediate School, and Rim Of The World Senior High School.
Ownership History
Date
Name
Owned For
Owner Type
Purchase Details
Closed on
Sep 18, 2009
Sold by
Powers Denise
Bought by
Carney Travis
Current Estimated Value
Home Financials for this Owner
Home Financials are based on the most recent Mortgage that was taken out on this home.
Original Mortgage
$224,852
Outstanding Balance
$146,003
Interest Rate
5.05%
Mortgage Type
FHA
Estimated Equity
$261,199
Purchase Details
Closed on
Apr 28, 2009
Sold by
Wood Joyce P
Bought by
Powers Denise M and The Wood House Trust
Purchase Details
Closed on
Sep 21, 1999
Sold by
Albertson Renee V
Bought by
Wood Joyce P
Home Financials for this Owner
Home Financials are based on the most recent Mortgage that was taken out on this home.
Original Mortgage
$114,000
Interest Rate
7.97%
Create a Home Valuation Report for This Property
The Home Valuation Report is an in-depth analysis detailing your home's value as well as a comparison with similar homes in the area
Home Values in the Area
Average Home Value in this Area
Purchase History
| Date | Buyer | Sale Price | Title Company |
|---|---|---|---|
| Carney Travis | $229,000 | Lawyers Title | |
| Powers Denise M | -- | None Available | |
| Wood Joyce P | $155,000 | First American Title Ins Co |
Source: Public Records
Mortgage History
| Date | Status | Borrower | Loan Amount |
|---|---|---|---|
| Open | Carney Travis | $224,852 | |
| Previous Owner | Wood Joyce P | $114,000 |
Source: Public Records
Tax History Compared to Growth
Tax History
| Year | Tax Paid | Tax Assessment Tax Assessment Total Assessment is a certain percentage of the fair market value that is determined by local assessors to be the total taxable value of land and additions on the property. | Land | Improvement |
|---|---|---|---|---|
| 2025 | $3,684 | $295,601 | $25,818 | $269,783 |
| 2024 | $3,684 | $289,805 | $25,312 | $264,493 |
| 2023 | $3,642 | $284,123 | $24,816 | $259,307 |
| 2022 | $3,573 | $278,552 | $24,329 | $254,223 |
| 2021 | $3,534 | $273,090 | $23,852 | $249,238 |
| 2020 | $3,534 | $270,289 | $23,607 | $246,682 |
| 2019 | $3,447 | $264,989 | $23,144 | $241,845 |
| 2018 | $3,257 | $259,793 | $22,690 | $237,103 |
| 2017 | $3,199 | $254,699 | $22,245 | $232,454 |
| 2016 | $3,102 | $249,705 | $21,809 | $227,896 |
| 2015 | $3,069 | $245,954 | $21,481 | $224,473 |
| 2014 | $3,019 | $241,136 | $21,060 | $220,076 |
Source: Public Records
Map
Nearby Homes
- 31521 Silver Spruce Dr
- 31557 Wagon Wheel Dr
- 31438 Easy St
- 31595 Luring Pines Dr
- 31605 Wagon Wheel Dr
- 31510 Valley Ridge Dr
- 31523 Pleasant Dr
- 31358 Lightfoot Way
- 31353 Lightfoot Way
- 0 Valley View Dr
- 2511 Catalina Dr
- 31686 Luring Pines Cir
- 31558 Ocean View Dr
- 31449 Onacrest Dr
- 31330 Marcella Dr
- 31347 Circle View Dr
- 31466 Onacrest Dr
- 2552 Catalina Dr
- 31662 Panorama Dr
- 0 Bear Dr Unit IV25050620
- 31515 Hilltop Blvd
- 31519 Hill Top Dr
- 31511 Hilltop Dr
- 31523 Hilltop Dr
- 31466 Pleasant Dr
- 2357 Rim of The World Dr
- 31470 Pleasant Dr
- 31506 Hilltop Dr
- 31507 Hilltop Blvd
- 31507 Hilltop Dr
- 31553 Hilltop Blvd
- 31527 Hilltop Dr
- 31527 Hilltop Blvd
- 2363 Rim of The World Dr
- 31474 Pleasant Dr
- 31475 Easy St
- 2358 Rim of The World Dr
- 31533 Hilltop Dr
- 31478 Pleasant Dr
- 31533 Hilltop Blvd