
Seller's Agent in 2025
Ava Khamooshi
AK Broker
(619) 375-5025
1 in this area
16 Total Sales
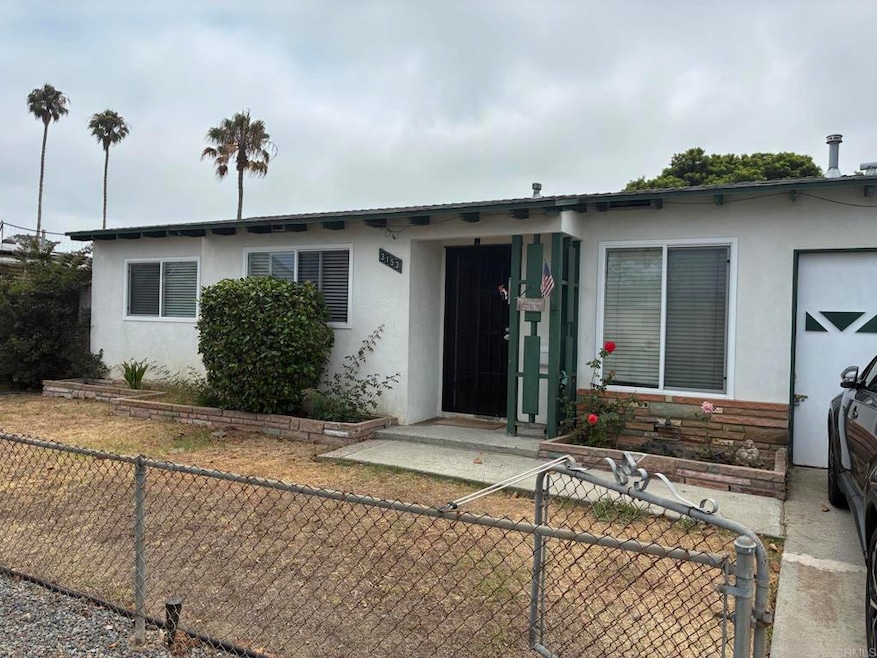


INVESTOR & DEVELOPERS! Welcome to 3153 Idlewild Way, San Diego CA 92117, an incredible development opportunity in one of San Diego’s most desirable central neighborhoods. This 3-bedroom, 1-bathroom single-story home offers 899 sq ft of living space situated on a spacious, flat 6,400+ sq ft lot. The home is in original condition, having some tasteful bathroom upgrades, making it the perfect starting point for investors, flippers, or homeowners ready to build sweat equity. With no HOA, a wide lot configuration, and alley access, the property offers the ideal layout for adding ADUs, a second story, or even a complete redevelopment. The large backyard provides more than enough room for a pool, garden, outdoor entertainment space, or multiple units—whatever your vision, this is your blank canvas. Whether you’re looking to modernize, expand, or build new, the possibilities here are endless. Offers encouraged immediately—auction-style pricing starts at $899,000. Submit your highest and best. This one will not last. Located in the highly sought-after Clairemont Mesa West community, this home sits just minutes from everything that makes San Diego one of the most livable cities in the country. You're less than 10 minutes from Mission Bay, Pacific Beach, La Jolla, and Downtown San Diego, and you’ll enjoy quick freeway access to the 5, 805, and 52. Clairemont offers the perfect blend of residential comfort and urban convenience, with nearby shopping at Target, Costco, Home Depot, and Clairemont Town Square. You’ll also find a wide selection of gyms, coffee shops, restaurants, and parks, as well as highly rated public and private schools. Outdoor enthusiasts will love the proximity to Tecolote Canyon Natural Park, Bay Park, and miles of scenic trails. Whether you're planning a rental portfolio, custom dream home, or a multi-unit investment play, this location delivers on lifestyle, access, and long-term upside.
| Date | Type | Sale Price | Title Company |
|---|---|---|---|
| Interfamily Deed Transfer | -- | Lawyers Title | |
| Grant Deed | $330,000 | Fidelity National Title Co | |
| Interfamily Deed Transfer | -- | None Available | |
| Interfamily Deed Transfer | -- | -- |
| Date | Status | Loan Amount | Loan Type |
|---|---|---|---|
| Open | $252,000 | New Conventional | |
| Closed | $264,000 | New Conventional |
| Date | Event | Price | Change | Sq Ft Price |
|---|---|---|---|---|
| 09/19/2025 09/19/25 | Sold | $800,000 | -5.8% | $890 / Sq Ft |
| 08/28/2025 08/28/25 | Pending | -- | -- | -- |
| 08/26/2025 08/26/25 | Price Changed | $849,000 | -5.6% | $944 / Sq Ft |
| 08/04/2025 08/04/25 | For Sale | $899,000 | -- | $1,000 / Sq Ft |
| Year | Tax Paid | Tax Assessment Tax Assessment Total Assessment is a certain percentage of the fair market value that is determined by local assessors to be the total taxable value of land and additions on the property. | Land | Improvement |
|---|---|---|---|---|
| 2025 | $5,125 | $422,773 | $358,721 | $64,052 |
| 2024 | $5,125 | $414,485 | $351,688 | $62,797 |
| 2023 | $5,012 | $406,359 | $344,793 | $61,566 |
| 2022 | $4,879 | $398,392 | $338,033 | $60,359 |
| 2021 | $4,846 | $390,581 | $331,405 | $59,176 |
| 2020 | $4,787 | $386,577 | $328,007 | $58,570 |
| 2019 | $4,702 | $378,998 | $321,576 | $57,422 |
| 2018 | $4,397 | $371,568 | $315,271 | $56,297 |
| 2017 | $4,292 | $364,284 | $309,090 | $55,194 |
| 2016 | $4,223 | $357,142 | $303,030 | $54,112 |
| 2015 | $4,161 | $351,779 | $298,479 | $53,300 |
| 2014 | $4,097 | $344,889 | $292,633 | $52,256 |
Seller's Agent in 2025
Ava Khamooshi
AK Broker
(619) 375-5025
1 in this area
16 Total Sales
Seller Co-Listing Agent in 2025
Lewis Bush
AK Broker
(904) 673-6223
1 in this area
1 Total Sale
Buyer's Agent in 2025
Christian Ballow
Gene Bowman Realty
(619) 207-7601
2 in this area
57 Total Sales
Source: California Regional Multiple Listing Service (CRMLS)
MLS Number: NDP2507675
APN: 359-172-06
Disclaimer: Certain information contained herein is derived from information provided by parties other than Homes.com. All information provided is deemed reliable, but is not guaranteed to be accurate and should be independently verified.
![]() The multiple listing data appearing on this website, or contained in reports produced therefrom, is owned and copyrighted by California Regional Multiple Listing Service, Inc. ("CRMLS") and is protected by all applicable copyright laws. Information provided is for viewer's personal, non-commercial use and may not be used for any purpose other than to identify prospective properties the viewer may be interested in purchasing. All listing data, including but not limited to square footage and lot size is believed to be accurate, but the listing Agent, listing Broker and CRMLS and its affiliates do not warrant or guarantee such accuracy. The viewer should independently verify the listed data prior to making any decisions based on such information by personal inspection and/or contacting a real estate professional.
The multiple listing data appearing on this website, or contained in reports produced therefrom, is owned and copyrighted by California Regional Multiple Listing Service, Inc. ("CRMLS") and is protected by all applicable copyright laws. Information provided is for viewer's personal, non-commercial use and may not be used for any purpose other than to identify prospective properties the viewer may be interested in purchasing. All listing data, including but not limited to square footage and lot size is believed to be accurate, but the listing Agent, listing Broker and CRMLS and its affiliates do not warrant or guarantee such accuracy. The viewer should independently verify the listed data prior to making any decisions based on such information by personal inspection and/or contacting a real estate professional.
Based on information from California Regional Multiple Listing Service, Inc. and /or other sources. All data, including all measurements and calculations of area, is obtained from various sources and has not been, and will not be, verified by broker or MLS. All information should be independently reviewed and verified for accuracy. Properties may or may not be listed by the office/agent presenting the information