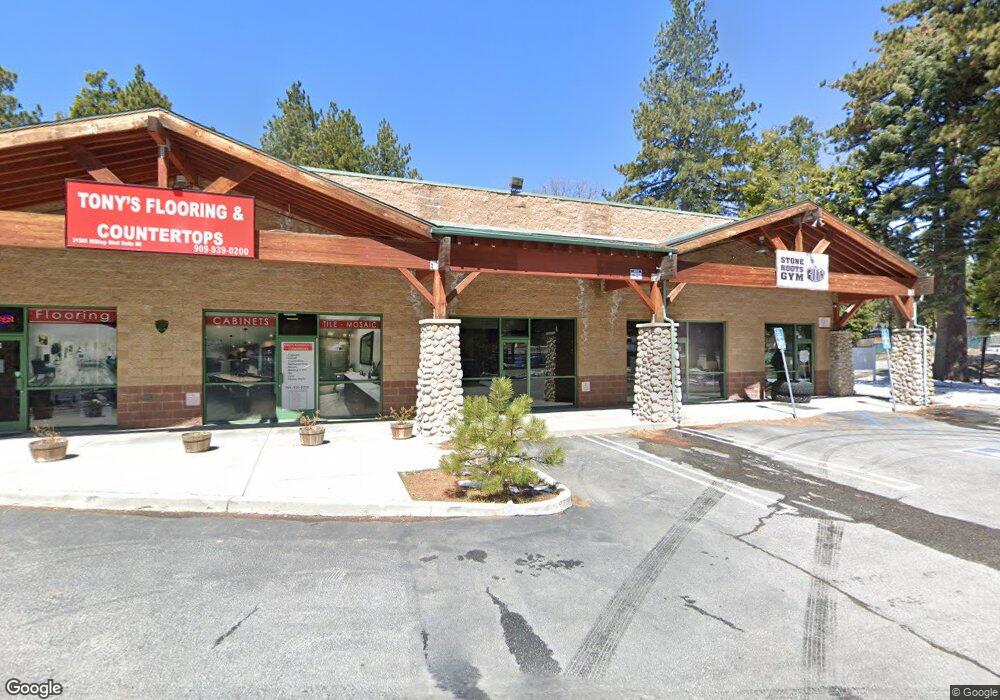
31565 Hilltop Blvd Unit C Running Springs, CA 92382
Estimated Value: $1,022,842
--
Bed
--
Bath
5,400
Sq Ft
$189/Sq Ft
Est. Value
About This Home
This home is located at 31565 Hilltop Blvd Unit C, Running Springs, CA 92382 and is currently estimated at $1,022,842, approximately $189 per square foot. 31565 Hilltop Blvd Unit C is a home located in San Bernardino County with nearby schools including Charles Hoffman Elementary School, Mary P. Henck Intermediate School, and Rim Of The World Senior High School.
Ownership History
Date
Name
Owned For
Owner Type
Purchase Details
Closed on
Oct 19, 2010
Sold by
Cpdc Inc
Bought by
Ad & Dd Llc
Current Estimated Value
Purchase Details
Closed on
Mar 21, 2005
Sold by
Alta Community Assn
Bought by
Cpdc Inc
Purchase Details
Closed on
May 14, 2002
Sold by
Community Partnership Development Corp
Bought by
Alta Community Assn
Purchase Details
Closed on
May 4, 1999
Sold by
Desantis Frank J and Desantis Penny Lynn
Bought by
Community Partnership Development Corp
Purchase Details
Closed on
Apr 8, 1999
Sold by
Poff Ronald G
Bought by
Desantis Frank J and Desantis Penny Lynn
Purchase Details
Closed on
Jan 17, 1996
Sold by
Running Springs Country Club Inc
Bought by
Poff Ronald G and Poff Ann C
Home Financials for this Owner
Home Financials are based on the most recent Mortgage that was taken out on this home.
Original Mortgage
$75,500
Interest Rate
6.87%
Mortgage Type
Seller Take Back
Create a Home Valuation Report for This Property
The Home Valuation Report is an in-depth analysis detailing your home's value as well as a comparison with similar homes in the area
Home Values in the Area
Average Home Value in this Area
Purchase History
| Date | Buyer | Sale Price | Title Company |
|---|---|---|---|
| Ad & Dd Llc | $485,000 | Stewart Title Company | |
| Cpdc Inc | -- | -- | |
| Alta Community Assn | -- | -- | |
| Alta Community Assn | -- | -- | |
| Community Partnership Development Corp | -- | -- | |
| Desantis Frank J | $85,000 | First Southwestern Title Co | |
| Poff Ronald G | $77,500 | First American Title Ins Co |
Source: Public Records
Mortgage History
| Date | Status | Borrower | Loan Amount |
|---|---|---|---|
| Previous Owner | Poff Ronald G | $75,500 |
Source: Public Records
Tax History Compared to Growth
Tax History
| Year | Tax Paid | Tax Assessment Tax Assessment Total Assessment is a certain percentage of the fair market value that is determined by local assessors to be the total taxable value of land and additions on the property. | Land | Improvement |
|---|---|---|---|---|
| 2025 | $13,872 | $1,167,329 | $265,302 | $902,027 |
| 2024 | $13,872 | $1,144,440 | $260,100 | $884,340 |
| 2023 | $13,588 | $1,122,000 | $255,000 | $867,000 |
| 2022 | $7,253 | $585,533 | $76,060 | $509,473 |
| 2021 | $7,171 | $574,052 | $74,569 | $499,483 |
| 2020 | $7,171 | $568,165 | $73,804 | $494,361 |
| 2019 | $6,987 | $557,025 | $72,357 | $484,668 |
| 2018 | $6,588 | $546,103 | $70,938 | $475,165 |
| 2017 | $6,465 | $535,395 | $69,547 | $465,848 |
| 2016 | $6,263 | $524,897 | $68,183 | $456,714 |
| 2015 | $6,192 | $517,013 | $67,159 | $449,854 |
| 2014 | $6,089 | $506,885 | $65,843 | $441,042 |
Source: Public Records
Map
Nearby Homes
- 31523 Pleasant Dr
- 31595 Luring Pines Dr
- 31521 Silver Spruce Dr
- 31557 Wagon Wheel Dr
- 31605 Wagon Wheel Dr
- 31558 Ocean View Dr
- 0 Valley View Dr
- 31662 Panorama Dr
- 31686 Luring Pines Cir
- 31600 City Creek Rd
- 31358 Lightfoot Way
- 2511 Catalina Dr
- 31438 Easy St
- 31353 Lightfoot Way
- 31330 Marcella Dr
- 31510 Valley Ridge Dr
- 31766 Silver Spruce Dr
- 0 Bear Dr Unit IV25050620
- 31771 Christmas Tree Ln
- 31765 Hilltop Dr
- 31565 Hilltop Dr
- 2527 Sunset Dr
- 31515 Pleasant Dr
- 31509 Pleasant Dr
- 31500 Pleasant Dr
- 31501 Pleasant Dr
- 31531 Pleasant Dr
- 2567 Sunset Dr
- 2532 Sunset Dr
- 31518 Hilltop Dr
- 31553 Hilltop Blvd
- 31498 Pleasant Dr
- 31559 Silver Spruce Dr
- 31497 Pleasant Dr
- 31551 Silver Spruce Dr
- 31517 Pleasant Dr
- 31576 Hilltop Dr
- 3 Inspiration Dr
- 31493 Pleasant Dr
- 31539 Silver Spruce