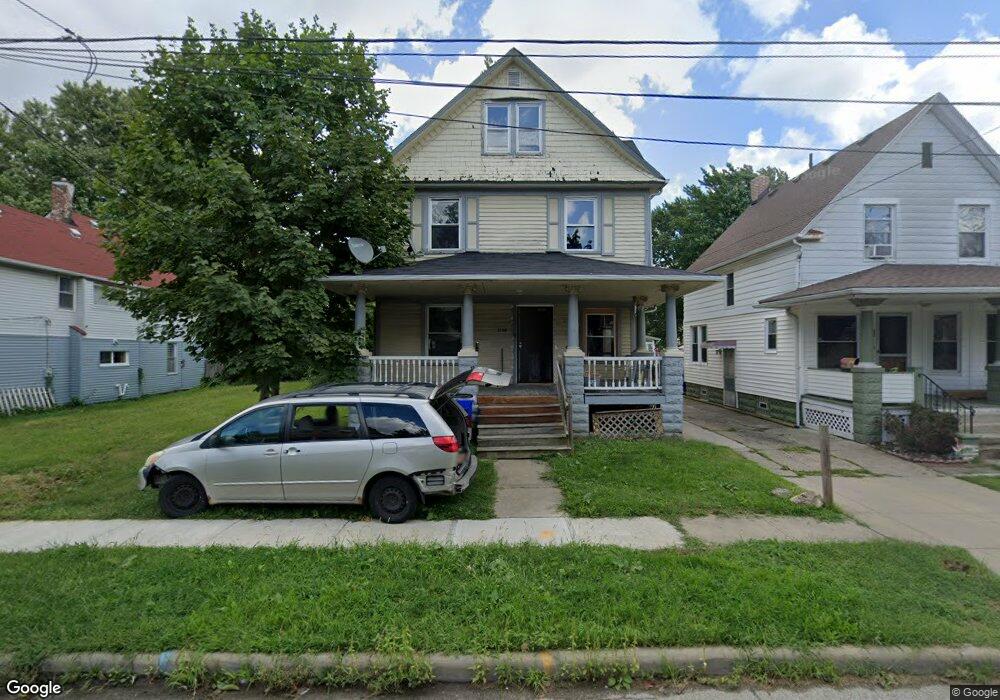
3159 W 88th St Cleveland, OH 44102
West Boulevard NeighborhoodEstimated Value: $113,000 - $142,000
3
Beds
1
Bath
1,509
Sq Ft
$83/Sq Ft
Est. Value
About This Home
This home is located at 3159 W 88th St, Cleveland, OH 44102 and is currently estimated at $125,924, approximately $83 per square foot. 3159 W 88th St is a home located in Cuyahoga County with nearby schools including Almira Academy, Artemus Ward School, and Anton Grdina School.
Ownership History
Date
Name
Owned For
Owner Type
Purchase Details
Closed on
Apr 2, 2021
Sold by
C Z Lord Properties Llc
Bought by
Gnfi Llc
Current Estimated Value
Purchase Details
Closed on
Mar 23, 2012
Sold by
Ral Properties Ltd
Bought by
R&M Mark Properties Llc
Purchase Details
Closed on
Nov 3, 2006
Sold by
Bankers Trust Co Of California Na
Bought by
Ral Properties Ltd
Purchase Details
Closed on
Oct 18, 2005
Sold by
Morales Natalie
Bought by
Bankers Trust Co Of California Na
Purchase Details
Closed on
Dec 17, 1990
Sold by
Schumann Paul
Bought by
Morales Natalie
Purchase Details
Closed on
Sep 16, 1988
Sold by
Dimatteo Cheryl
Bought by
Schumann Paul
Purchase Details
Closed on
Jun 15, 1988
Sold by
Lois K Seivert
Bought by
Dimatteo Cheryl
Purchase Details
Closed on
Apr 19, 1988
Sold by
Seivert George and Seivert Lois
Bought by
Lois K Seivert
Purchase Details
Closed on
Jan 1, 1975
Bought by
Seivert George and Seivert Lois
Create a Home Valuation Report for This Property
The Home Valuation Report is an in-depth analysis detailing your home's value as well as a comparison with similar homes in the area
Home Values in the Area
Average Home Value in this Area
Purchase History
| Date | Buyer | Sale Price | Title Company |
|---|---|---|---|
| Gnfi Llc | $1,039,250 | Gangemi Maria J | |
| R&M Mark Properties Llc | $22,500 | Attorney | |
| Ral Properties Ltd | $32,500 | Fidelity | |
| Bankers Trust Co Of California Na | $35,334 | Attorney | |
| Morales Natalie | $34,500 | -- | |
| Schumann Paul | $8,000 | -- | |
| Dimatteo Cheryl | -- | -- | |
| Lois K Seivert | -- | -- | |
| Seivert George | -- | -- |
Source: Public Records
Tax History Compared to Growth
Tax History
| Year | Tax Paid | Tax Assessment Tax Assessment Total Assessment is a certain percentage of the fair market value that is determined by local assessors to be the total taxable value of land and additions on the property. | Land | Improvement |
|---|---|---|---|---|
| 2024 | $1,942 | $29,050 | $7,070 | $21,980 |
| 2023 | $1,678 | $21,640 | $3,540 | $18,100 |
| 2022 | $1,668 | $21,630 | $3,540 | $18,100 |
| 2021 | $1,652 | $21,630 | $3,540 | $18,100 |
| 2020 | $1,472 | $16,660 | $2,730 | $13,930 |
| 2019 | $1,363 | $47,600 | $7,800 | $39,800 |
| 2018 | $1,359 | $16,660 | $2,730 | $13,930 |
| 2017 | $601 | $7,110 | $3,150 | $3,960 |
| 2016 | $597 | $7,110 | $3,150 | $3,960 |
| 2015 | $3,477 | $7,110 | $3,150 | $3,960 |
| 2014 | $3,477 | $7,880 | $3,500 | $4,380 |
Source: Public Records
Map
Nearby Homes
- 3197 W 90th St
- 3147 W 84th St
- 3211 W 86th St
- 3118 W 82nd St
- 3181 W 82nd St
- 8016 Halle Ave
- 3235 W 94th St
- 3288 W 91st St
- 9510 Denison Ave
- 3303 W 90th St
- 7501 Brinsmade Ave
- 7410 Brinsmade Ave
- 7505 Halle Ave
- 8301 Denison Ave
- 0 W Tech Way Unit 5155337
- 7401 Brinsmade Ave
- 3318 W 94th St
- 3342 W 84th St
- 3172 W 73rd St
- 3334 W 82nd St