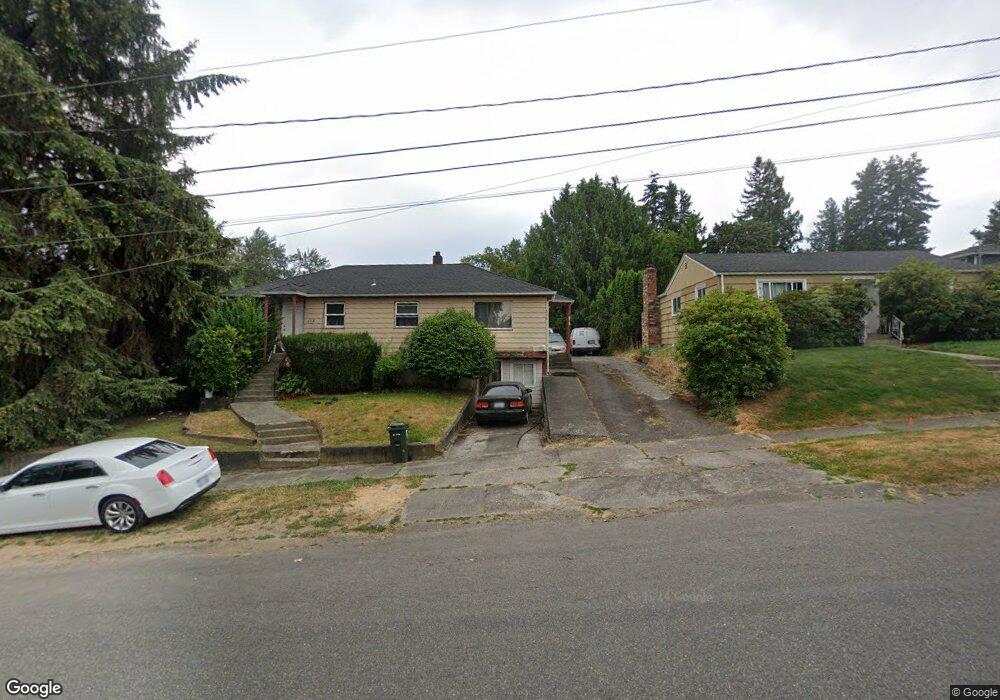
316 E 46th St Unit 318 Tacoma, WA 98404
Eastside NeighborhoodEstimated Value: $389,983 - $552,000
3
Beds
3
Baths
1,056
Sq Ft
$438/Sq Ft
Est. Value
About This Home
This home is located at 316 E 46th St Unit 318, Tacoma, WA 98404 and is currently estimated at $462,996, approximately $438 per square foot. 316 E 46th St Unit 318 is a home located in Pierce County with nearby schools including Lyon, Hunt Middle School, and Lincoln High School.
Ownership History
Date
Name
Owned For
Owner Type
Purchase Details
Closed on
Feb 10, 2020
Sold by
Williams Crystal P
Bought by
Williams Terrence
Current Estimated Value
Purchase Details
Closed on
Aug 20, 2001
Sold by
Hud
Bought by
Williams Terrance
Home Financials for this Owner
Home Financials are based on the most recent Mortgage that was taken out on this home.
Original Mortgage
$79,800
Outstanding Balance
$30,588
Interest Rate
6.91%
Mortgage Type
Purchase Money Mortgage
Estimated Equity
$432,408
Purchase Details
Closed on
Mar 23, 2001
Sold by
Nebel Theresa M
Bought by
Gmac Mtg Corp
Purchase Details
Closed on
Jun 24, 1999
Sold by
Clark David M
Bought by
Nebel Theresa M
Home Financials for this Owner
Home Financials are based on the most recent Mortgage that was taken out on this home.
Original Mortgage
$78,850
Interest Rate
7.05%
Mortgage Type
Purchase Money Mortgage
Create a Home Valuation Report for This Property
The Home Valuation Report is an in-depth analysis detailing your home's value as well as a comparison with similar homes in the area
Home Values in the Area
Average Home Value in this Area
Purchase History
| Date | Buyer | Sale Price | Title Company |
|---|---|---|---|
| Williams Terrence | -- | Ticor Title | |
| Williams Terrance | -- | First American Title Ins Co | |
| Gmac Mtg Corp | $87,034 | -- | |
| Hud | -- | -- | |
| Nebel Theresa M | $79,500 | First American Title Ins Co |
Source: Public Records
Mortgage History
| Date | Status | Borrower | Loan Amount |
|---|---|---|---|
| Open | Williams Terrance | $79,800 | |
| Previous Owner | Nebel Theresa M | $78,850 |
Source: Public Records
Tax History Compared to Growth
Tax History
| Year | Tax Paid | Tax Assessment Tax Assessment Total Assessment is a certain percentage of the fair market value that is determined by local assessors to be the total taxable value of land and additions on the property. | Land | Improvement |
|---|---|---|---|---|
| 2025 | $4,217 | $415,500 | $199,700 | $215,800 |
| 2024 | $4,217 | $410,100 | $188,600 | $221,500 |
| 2023 | $4,217 | $378,600 | $179,400 | $199,200 |
| 2022 | $4,006 | $420,000 | $188,900 | $231,100 |
| 2021 | $3,773 | $300,000 | $112,400 | $187,600 |
| 2019 | $2,883 | $248,900 | $94,000 | $154,900 |
| 2018 | $2,955 | $221,600 | $75,600 | $146,000 |
| 2017 | $2,493 | $186,900 | $63,700 | $123,200 |
| 2016 | $2,245 | $139,200 | $47,200 | $92,000 |
| 2014 | $1,843 | $129,000 | $46,500 | $82,500 |
| 2013 | $1,843 | $112,000 | $40,800 | $71,200 |
Source: Public Records
Map
Nearby Homes