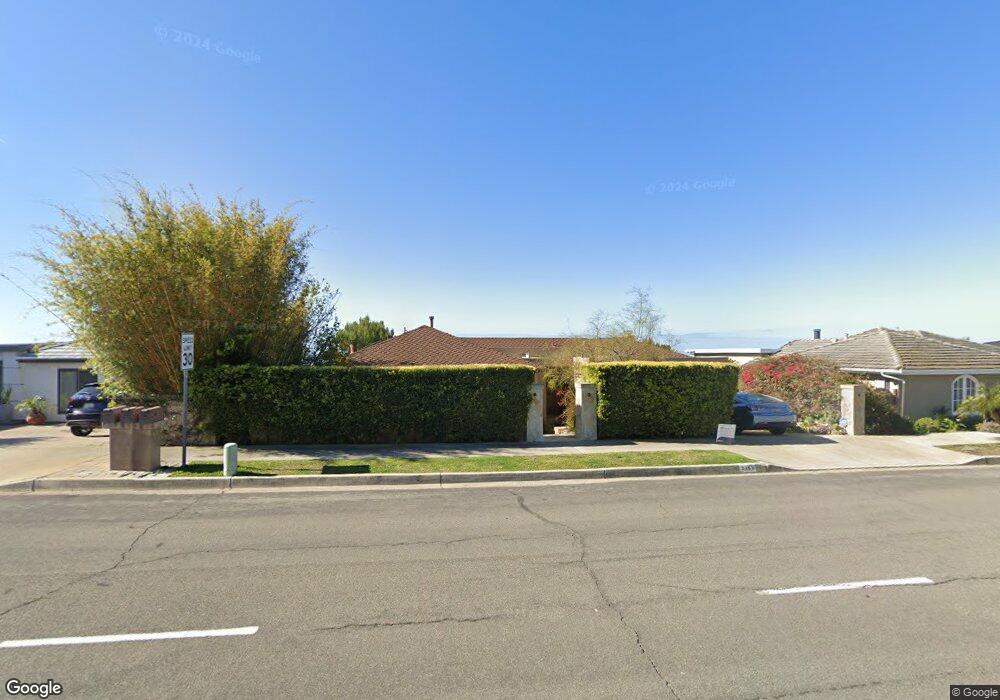
3161 Alta Laguna Blvd Laguna Beach, CA 92651
Top of the World NeighborhoodEstimated Value: $2,516,000 - $3,287,000
3
Beds
2
Baths
1,920
Sq Ft
$1,515/Sq Ft
Est. Value
About This Home
This home is located at 3161 Alta Laguna Blvd, Laguna Beach, CA 92651 and is currently estimated at $2,908,867, approximately $1,515 per square foot. 3161 Alta Laguna Blvd is a home located in Orange County with nearby schools including Top Of The World Elementary School, Thurston Middle School, and Laguna Beach High School.
Ownership History
Date
Name
Owned For
Owner Type
Purchase Details
Closed on
Aug 8, 2003
Sold by
Peterson Madeleine K
Bought by
Peterson Madeleine K and Peterson Living Trust
Current Estimated Value
Purchase Details
Closed on
Jul 19, 2001
Sold by
Peterson Madeleine K
Bought by
Peterson Madeleine K
Home Financials for this Owner
Home Financials are based on the most recent Mortgage that was taken out on this home.
Original Mortgage
$600,000
Outstanding Balance
$232,401
Interest Rate
7.21%
Estimated Equity
$2,676,467
Purchase Details
Closed on
May 27, 1999
Sold by
Michael Peterson and Michael Madeleine
Bought by
Peterson Michael J and Peterson Madeleine K
Purchase Details
Closed on
Aug 19, 1996
Sold by
Roser Michael C and Roser Miriam N
Bought by
Peterson Michael J and Peterson Madeleine K
Home Financials for this Owner
Home Financials are based on the most recent Mortgage that was taken out on this home.
Original Mortgage
$310,000
Interest Rate
7.75%
Create a Home Valuation Report for This Property
The Home Valuation Report is an in-depth analysis detailing your home's value as well as a comparison with similar homes in the area
Home Values in the Area
Average Home Value in this Area
Purchase History
| Date | Buyer | Sale Price | Title Company |
|---|---|---|---|
| Peterson Madeleine K | -- | -- | |
| Peterson Madeleine K | -- | United Title Company | |
| Peterson Michael J | -- | -- | |
| Peterson Michael J | $425,000 | Chicago Title Co |
Source: Public Records
Mortgage History
| Date | Status | Borrower | Loan Amount |
|---|---|---|---|
| Open | Peterson Madeleine K | $600,000 | |
| Previous Owner | Peterson Michael J | $310,000 |
Source: Public Records
Tax History Compared to Growth
Tax History
| Year | Tax Paid | Tax Assessment Tax Assessment Total Assessment is a certain percentage of the fair market value that is determined by local assessors to be the total taxable value of land and additions on the property. | Land | Improvement |
|---|---|---|---|---|
| 2025 | $9,801 | $892,207 | $551,909 | $340,298 |
| 2024 | $9,801 | $874,713 | $541,087 | $333,626 |
| 2023 | $9,873 | $857,562 | $530,477 | $327,085 |
| 2022 | $9,625 | $840,748 | $520,076 | $320,672 |
| 2021 | $9,380 | $824,263 | $509,878 | $314,385 |
| 2020 | $9,218 | $815,812 | $504,650 | $311,162 |
| 2019 | $9,033 | $799,816 | $494,755 | $305,061 |
| 2018 | $8,842 | $784,134 | $485,054 | $299,080 |
| 2017 | $8,647 | $768,759 | $475,543 | $293,216 |
| 2016 | $8,465 | $753,686 | $466,219 | $287,467 |
| 2015 | $8,317 | $742,365 | $459,216 | $283,149 |
| 2014 | $8,145 | $727,824 | $450,221 | $277,603 |
Source: Public Records
Map
Nearby Homes
- 3120 Bern Dr
- 3143 Bonn Dr
- 3053 Nestall Rd
- 2516 Temple Hills Dr
- 2938 Chillon Way
- 2072 Hidden Valley Canyon Rd
- 3355 Alta Laguna Blvd
- 2840 Zell Dr
- 2888 Bernard Ct
- 2858 Bernard Ct
- 28822 Alta Laguna Blvd
- 2155 Temple Hills Dr
- 1598 Skyline Dr
- 1981 San Remo Dr
- 1969 San Remo Dr
- 1961 San Remo Dr
- 1961 Temple Hills Dr
- 1950 Upper Rim Rock Rd
- 1505 Morningside Dr
- 1450 Terrace Way
- 3155 Alta Laguna Blvd
- 3167 Alta Laguna Blvd
- 3149 Alta Laguna Blvd
- 3155 Bern Dr
- 3173 Alta Laguna Blvd
- 3161 Bern Dr
- 3143 Alta Laguna Blvd
- 3160 Alta Laguna Blvd
- 3168 Alta Laguna Blvd
- 3108 Tyrol Dr
- 3149 Bern Dr
- 3179 Alta Laguna Blvd
- 3167 Bern Dr
- 3150 Alta Laguna Blvd
- 3137 Alta Laguna Blvd
- 3178 Alta Laguna Blvd
- 3143 Bern Dr
- 3144 Alta Laguna Blvd
- 3173 Bern Dr
- 3145 Mountain View Dr