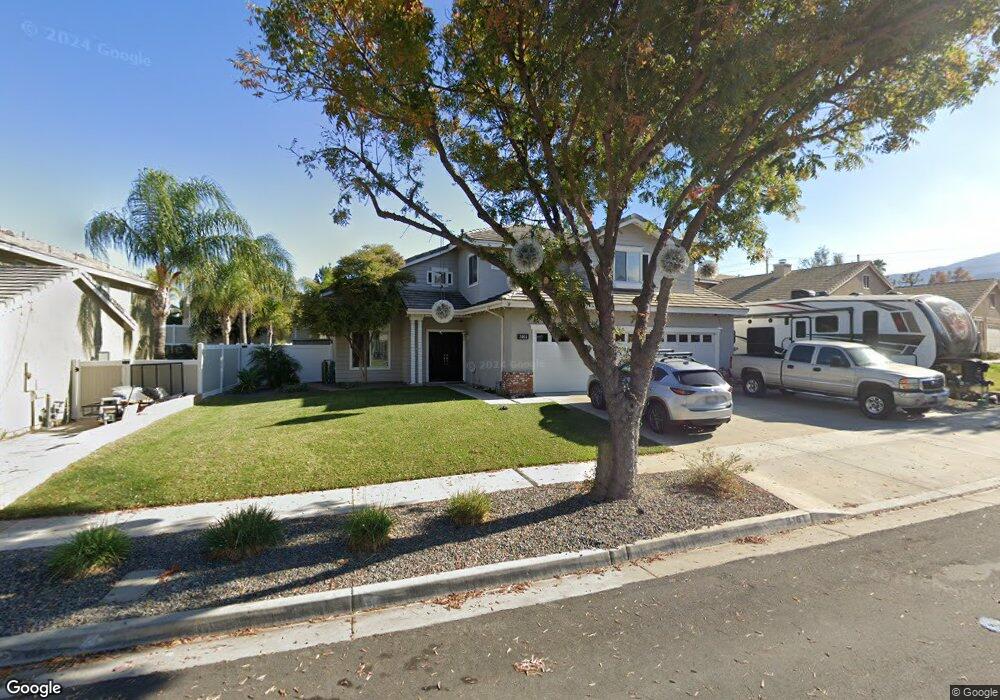
3161 Hideout Ln Corona, CA 92882
South Corona NeighborhoodEstimated Value: $876,410 - $958,000
4
Beds
3
Baths
2,287
Sq Ft
$395/Sq Ft
Est. Value
About This Home
This home is located at 3161 Hideout Ln, Corona, CA 92882 and is currently estimated at $903,103, approximately $394 per square foot. 3161 Hideout Ln is a home located in Riverside County with nearby schools including Foothill Elementary School, Citrus Hills Intermediate School, and Santiago High School.
Ownership History
Date
Name
Owned For
Owner Type
Purchase Details
Closed on
Feb 21, 2021
Sold by
Heying Daniel and Heying Summer
Bought by
Heying Daniel and Heying Summer
Current Estimated Value
Purchase Details
Closed on
Sep 12, 2002
Sold by
Esler Scott G and Weetman Esler Michelle M
Bought by
Heying Daniel and Heying Summer
Home Financials for this Owner
Home Financials are based on the most recent Mortgage that was taken out on this home.
Original Mortgage
$230,000
Outstanding Balance
$95,588
Interest Rate
6.17%
Mortgage Type
Purchase Money Mortgage
Estimated Equity
$807,515
Purchase Details
Closed on
Sep 16, 1999
Sold by
Esler Scott G and Weetman Michelle M
Bought by
Esler Scott G and Weetman Esler Michelle M
Purchase Details
Closed on
Jan 24, 1996
Sold by
Shea Homes Ltd Partnership
Bought by
Esler Scott G and Weetman Michelle M
Home Financials for this Owner
Home Financials are based on the most recent Mortgage that was taken out on this home.
Original Mortgage
$170,950
Interest Rate
7.25%
Mortgage Type
Purchase Money Mortgage
Create a Home Valuation Report for This Property
The Home Valuation Report is an in-depth analysis detailing your home's value as well as a comparison with similar homes in the area
Home Values in the Area
Average Home Value in this Area
Purchase History
| Date | Buyer | Sale Price | Title Company |
|---|---|---|---|
| Heying Daniel | -- | None Available | |
| Heying Daniel | $328,000 | Fidelity National Title Ins | |
| Esler Scott G | -- | -- | |
| Esler Scott G | $180,000 | Chicago Title |
Source: Public Records
Mortgage History
| Date | Status | Borrower | Loan Amount |
|---|---|---|---|
| Open | Heying Daniel | $230,000 | |
| Previous Owner | Esler Scott G | $170,950 |
Source: Public Records
Tax History Compared to Growth
Tax History
| Year | Tax Paid | Tax Assessment Tax Assessment Total Assessment is a certain percentage of the fair market value that is determined by local assessors to be the total taxable value of land and additions on the property. | Land | Improvement |
|---|---|---|---|---|
| 2025 | $5,565 | $497,746 | $115,853 | $381,893 |
| 2023 | $5,565 | $478,419 | $111,355 | $367,064 |
| 2022 | $5,391 | $469,039 | $109,172 | $359,867 |
| 2021 | $5,287 | $459,843 | $107,032 | $352,811 |
| 2020 | $5,230 | $455,129 | $105,935 | $349,194 |
| 2019 | $5,111 | $446,206 | $103,858 | $342,348 |
| 2018 | $5,643 | $437,458 | $101,823 | $335,635 |
| 2017 | $5,718 | $428,881 | $99,827 | $329,054 |
| 2016 | $5,707 | $420,472 | $97,870 | $322,602 |
| 2015 | $5,616 | $414,157 | $96,400 | $317,757 |
| 2014 | $5,475 | $406,046 | $94,512 | $311,534 |
Source: Public Records
Map
Nearby Homes
- 3141 Brunstane Cir
- 3133 Windhaven Way Unit 50
- 3231 Hannover St
- 1066 Royal Oaks Cir
- 832 Carolina Cir
- 1153 Archer Cir Unit 89
- 935 Rustlers Way
- 2898 Briarhaven Ln
- 2775 S Buena Vista Ave
- 3384 Amethyst St
- 825 Derby St
- 675 Avenida Terrazo
- 2775 Canyon View Cir
- 1185 Bridgeport Rd
- 2621 Grove Ave
- 3090 Mangular Ave
- 1336 Old Trail Dr
- 975 Horatio Ave
- 2476 Grove Ave
- 1372 Old Trail Dr
- 3153 Hideout Ln
- 3169 Hideout Ln
- 3160 Gunsmoke Rd
- 3147 Hideout Ln
- 3177 Hideout Ln
- 3150 Gunsmoke Rd
- 3180 Gunsmoke Rd
- 3160 Hideout Ln
- 3139 Hideout Ln
- 3168 Hideout Ln
- 3152 Hideout Ln
- 3140 Gunsmoke Rd
- 3148 Hideout Ln
- 3176 Hideout Ln
- 1072 Silvercreek Rd
- 3184 Hideout Ln
- 1021 Stetson Cir
- 1082 Silvercreek Rd
- 1024 Silvercreek Rd
- 1062 Stetson Cir