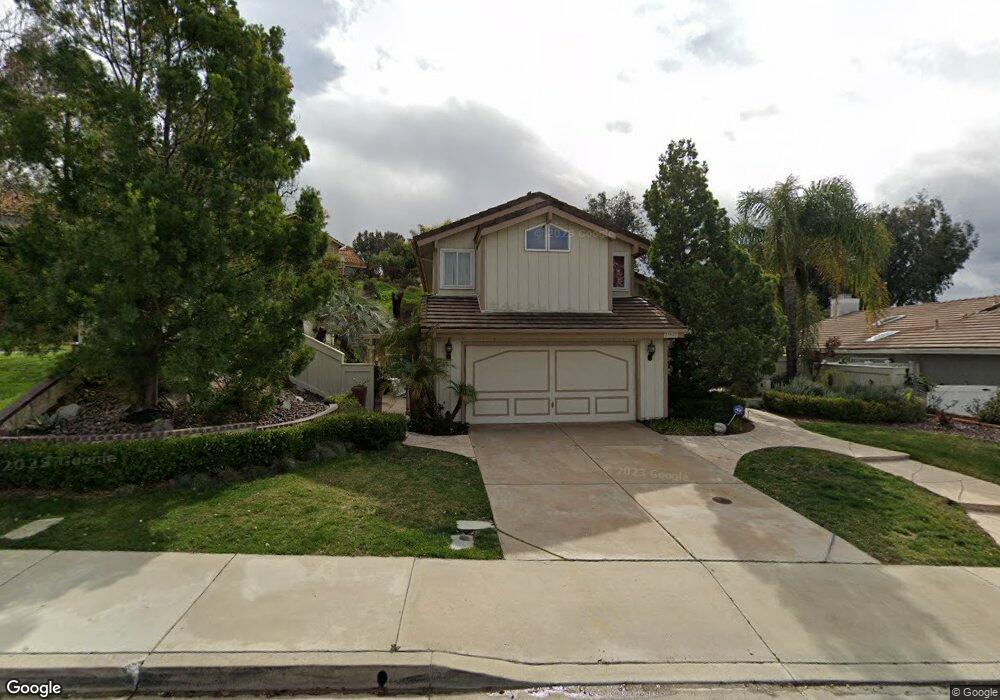
31681 Paseo de Las Olas Temecula, CA 92592
Margarita Village-Temeku Hills NeighborhoodEstimated Value: $684,000 - $720,000
3
Beds
3
Baths
1,636
Sq Ft
$429/Sq Ft
Est. Value
About This Home
This home is located at 31681 Paseo de Las Olas, Temecula, CA 92592 and is currently estimated at $702,551, approximately $429 per square foot. 31681 Paseo de Las Olas is a home located in Riverside County with nearby schools including Vintage Hills Elementary School, Temecula Middle School, and Temecula Valley High School.
Ownership History
Date
Name
Owned For
Owner Type
Purchase Details
Closed on
May 27, 2025
Sold by
Ciebrant Elizabeth J
Bought by
Elizabeth Joan Ciebrant Revocable Living Trus and Ciebrant
Current Estimated Value
Purchase Details
Closed on
Mar 14, 2000
Sold by
Brown Stephen R and Brown Donna
Bought by
Ciebrant Elizabeth J
Home Financials for this Owner
Home Financials are based on the most recent Mortgage that was taken out on this home.
Original Mortgage
$171,089
Interest Rate
8.18%
Mortgage Type
FHA
Purchase Details
Closed on
Apr 23, 1998
Sold by
Carol Rigby
Bought by
Brown Stephen R and Brown Donna
Home Financials for this Owner
Home Financials are based on the most recent Mortgage that was taken out on this home.
Original Mortgage
$115,900
Interest Rate
7.13%
Mortgage Type
Purchase Money Mortgage
Purchase Details
Closed on
Apr 27, 1993
Sold by
Rigby Dennis
Bought by
Rigby Carol
Create a Home Valuation Report for This Property
The Home Valuation Report is an in-depth analysis detailing your home's value as well as a comparison with similar homes in the area
Home Values in the Area
Average Home Value in this Area
Purchase History
| Date | Buyer | Sale Price | Title Company |
|---|---|---|---|
| Elizabeth Joan Ciebrant Revocable Living Trus | -- | None Listed On Document | |
| Ciebrant Elizabeth J | $172,500 | Fidelity National Title Ins | |
| Brown Stephen R | $145,000 | First American Title Ins Co | |
| Rigby Carol | -- | -- |
Source: Public Records
Mortgage History
| Date | Status | Borrower | Loan Amount |
|---|---|---|---|
| Previous Owner | Ciebrant Elizabeth J | $171,089 | |
| Previous Owner | Brown Stephen R | $115,900 |
Source: Public Records
Tax History Compared to Growth
Tax History
| Year | Tax Paid | Tax Assessment Tax Assessment Total Assessment is a certain percentage of the fair market value that is determined by local assessors to be the total taxable value of land and additions on the property. | Land | Improvement |
|---|---|---|---|---|
| 2025 | $3,770 | $299,806 | $53,777 | $246,029 |
| 2023 | $3,770 | $288,166 | $51,690 | $236,476 |
| 2022 | $3,651 | $282,517 | $50,677 | $231,840 |
| 2021 | $3,573 | $276,979 | $49,684 | $227,295 |
| 2020 | $3,534 | $274,140 | $49,175 | $224,965 |
| 2019 | $3,482 | $268,765 | $48,211 | $220,554 |
| 2018 | $3,412 | $263,496 | $47,266 | $216,230 |
| 2017 | $3,351 | $258,331 | $46,340 | $211,991 |
| 2016 | $3,290 | $253,267 | $45,432 | $207,835 |
| 2015 | $3,232 | $249,464 | $44,750 | $204,714 |
| 2014 | $3,136 | $244,579 | $43,874 | $200,705 |
Source: Public Records
Map
Nearby Homes
- 31670 Corte Encinas
- 42192 Delmonte St
- 41768 Via el Greco
- 0 Green Tree Rd Unit 178 250037799
- 41686 Monterey Place
- 41606 Slice Way
- 41973 Niblick Rd
- 41657 Cypress Point Way
- 32032 Merlot Crest
- 32099 Corte Carmela
- 42898 Calle Londe
- 32249 Cour Meyney
- 31060 Corte Anza
- 32284 Placer Belair
- 30839 Brassie Ln
- 31461 Congressional Dr
- 31425 Culbertson Ln
- 31130 S General Kearny Rd Unit 174
- 31130 S General Kearny Rd Unit 136
- 31130 S General Kearny Rd Unit 134
- 31669 Paseo de Las Olas
- 31638 Paseo Goleta
- 31628 Paseo Goleta
- 31657 Paseo de Las Olas
- 31650 Paseo Goleta
- 31617 Corte Salinas
- 31657 Corte Encinas
- 31616 Paseo Goleta
- 31645 Paseo de Las Olas
- 31660 Paseo Goleta
- 31675 Corte Encinas
- 31609 Corte Salinas
- 31606 Paseo Goleta
- 31708 Paseo de Las Olas
- 31689 Corte Encinas
- 31601 Corte Salinas
- 31672 Paseo Goleta
- 31594 Paseo Goleta
- 31699 Corte Encinas
- 31658 Corte Encinas