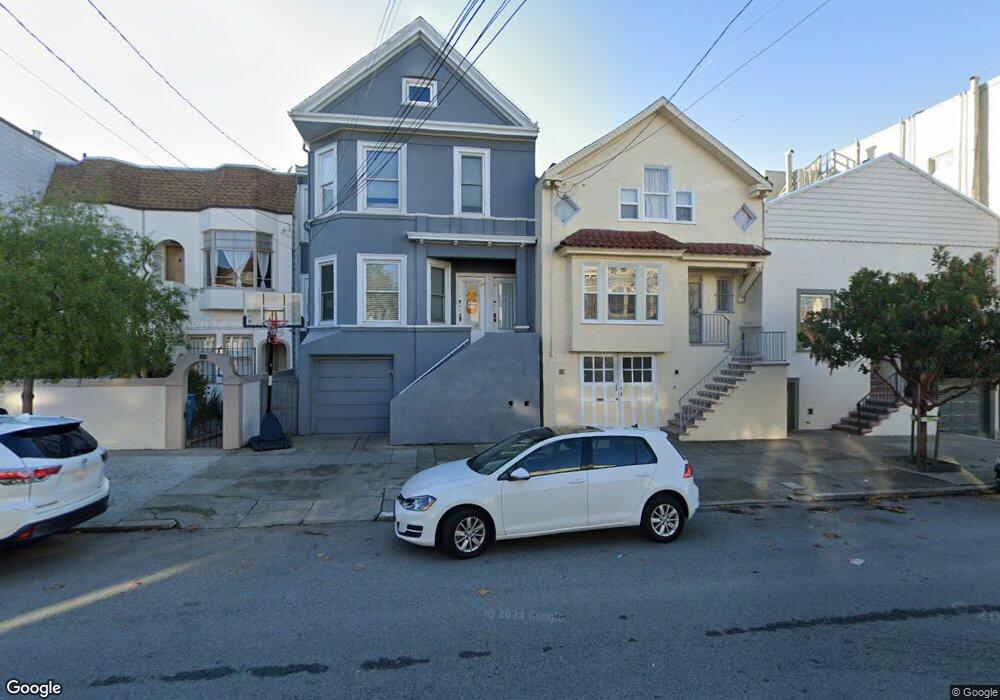
317 15th Ave Unit 319 San Francisco, CA 94118
Central Richmond NeighborhoodEstimated Value: $1,640,000 - $2,102,000
--
Bed
2
Baths
2,340
Sq Ft
$773/Sq Ft
Est. Value
About This Home
This home is located at 317 15th Ave Unit 319, San Francisco, CA 94118 and is currently estimated at $1,808,907, approximately $773 per square foot. 317 15th Ave Unit 319 is a home located in San Francisco County with nearby schools including Alamo Elementary School, Presidio Middle School, and Stratford School - San Francisco 14th Avenue.
Ownership History
Date
Name
Owned For
Owner Type
Purchase Details
Closed on
May 30, 2014
Sold by
Vanden Ende Lennart and Vanden Van Den
Bought by
Ende Lennart Van Den and Ende Yuki
Current Estimated Value
Home Financials for this Owner
Home Financials are based on the most recent Mortgage that was taken out on this home.
Original Mortgage
$300,000
Outstanding Balance
$228,786
Interest Rate
4.27%
Mortgage Type
Credit Line Revolving
Estimated Equity
$1,580,121
Purchase Details
Closed on
Mar 5, 2014
Sold by
Vanden Ende Yuki and Vanden Van Den
Bought by
Vanden Ende Lennart and Vanden Van Den
Purchase Details
Closed on
Aug 4, 1998
Sold by
Tru Neustadt Sylvia & Erwin Revoc Livin
Bought by
Vandenende Lennart and Vandenende Yuki
Home Financials for this Owner
Home Financials are based on the most recent Mortgage that was taken out on this home.
Original Mortgage
$352,000
Interest Rate
6.75%
Mortgage Type
Commercial
Create a Home Valuation Report for This Property
The Home Valuation Report is an in-depth analysis detailing your home's value as well as a comparison with similar homes in the area
Home Values in the Area
Average Home Value in this Area
Purchase History
| Date | Buyer | Sale Price | Title Company |
|---|---|---|---|
| Ende Lennart Van Den | -- | None Available | |
| Vanden Ende Lennart | -- | None Available | |
| Vanden Ende Lennart | -- | None Available | |
| Vandenende Lennart | $440,000 | Old Republic Title Company |
Source: Public Records
Mortgage History
| Date | Status | Borrower | Loan Amount |
|---|---|---|---|
| Open | Vanden Ende Lennart | $300,000 | |
| Previous Owner | Vandenende Lennart | $352,000 | |
| Closed | Vandenende Lennart | $44,000 |
Source: Public Records
Tax History Compared to Growth
Tax History
| Year | Tax Paid | Tax Assessment Tax Assessment Total Assessment is a certain percentage of the fair market value that is determined by local assessors to be the total taxable value of land and additions on the property. | Land | Improvement |
|---|---|---|---|---|
| 2025 | $8,711 | $689,774 | $376,240 | $313,534 |
| 2024 | $8,711 | $676,250 | $368,863 | $307,387 |
| 2023 | $8,574 | $662,991 | $361,631 | $301,360 |
| 2022 | $8,401 | $649,992 | $354,541 | $295,451 |
| 2021 | $8,249 | $637,248 | $347,590 | $289,658 |
| 2020 | $8,299 | $630,714 | $344,026 | $286,688 |
| 2019 | $8,018 | $618,348 | $337,281 | $281,067 |
| 2018 | $7,749 | $606,224 | $330,668 | $275,556 |
| 2017 | $7,359 | $594,338 | $324,185 | $270,153 |
| 2016 | $7,223 | $582,685 | $317,829 | $264,856 |
| 2015 | $7,133 | $573,933 | $313,055 | $260,878 |
| 2014 | $6,946 | $562,691 | $306,923 | $255,768 |
Source: Public Records
Map
Nearby Homes
- 1533 Clement St
- 251-255 14th Ave
- 428 15th Ave
- 369 18th Ave Unit 203
- 1827 Clement St
- 172 18th Ave
- 118 15th Ave
- 118-120 15th Ave
- 459 11th Ave
- 4829 California St
- 1324 Lake St
- 1608 Balboa St
- 607 15th Ave
- 1545-1547 Balboa St
- 1 18th Ave
- 171 9th Ave Unit 173
- 4328 Geary Blvd
- 1532 Cabrillo St
- 329 7th Ave
- 519 22nd Ave