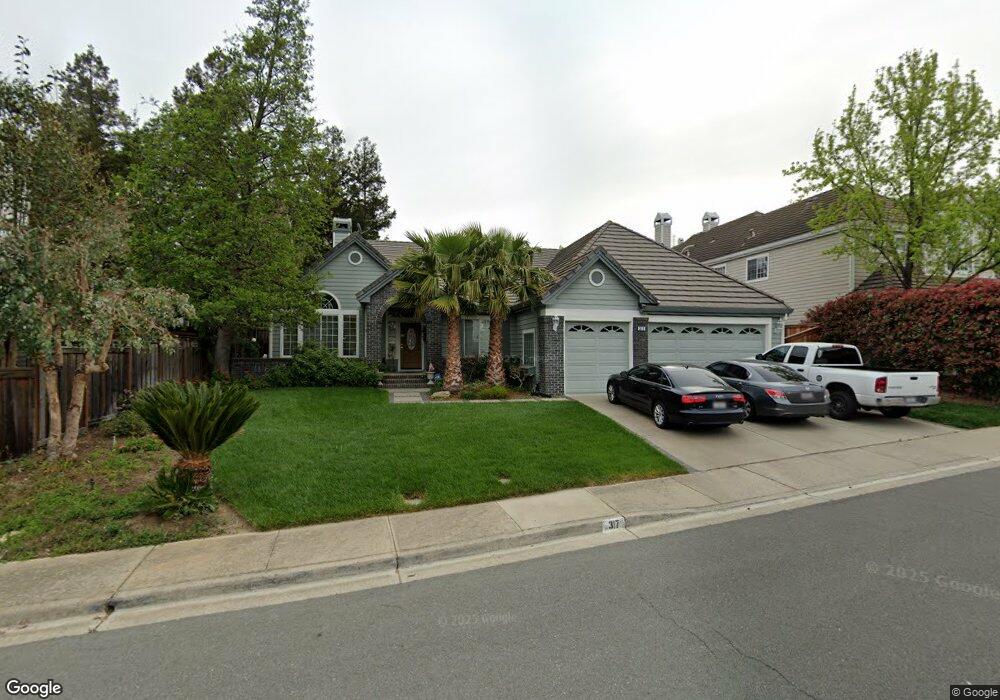
317 Ahwanee Ln Clayton, CA 94517
Estimated Value: $1,319,223 - $1,459,000
4
Beds
3
Baths
2,448
Sq Ft
$561/Sq Ft
Est. Value
About This Home
This home is located at 317 Ahwanee Ln, Clayton, CA 94517 and is currently estimated at $1,372,556, approximately $560 per square foot. 317 Ahwanee Ln is a home located in Contra Costa County with nearby schools including Mt. Diablo Elementary School, Diablo View Middle School, and College Park High School.
Ownership History
Date
Name
Owned For
Owner Type
Purchase Details
Closed on
May 21, 2003
Sold by
Wood Ronald W and Wood Holly M
Bought by
Collyer Richard A and Collyer Patricia A
Current Estimated Value
Home Financials for this Owner
Home Financials are based on the most recent Mortgage that was taken out on this home.
Original Mortgage
$395,000
Outstanding Balance
$171,174
Interest Rate
5.75%
Mortgage Type
Purchase Money Mortgage
Estimated Equity
$1,201,382
Purchase Details
Closed on
Aug 27, 1999
Sold by
Ok Greenwald Hyun
Bought by
Wood Ronald W and Wood Holly M
Home Financials for this Owner
Home Financials are based on the most recent Mortgage that was taken out on this home.
Original Mortgage
$348,000
Interest Rate
7.47%
Mortgage Type
Stand Alone First
Purchase Details
Closed on
Sep 25, 1998
Sold by
Greenwald Jeffrey
Bought by
Greenwald Hyun Ok
Create a Home Valuation Report for This Property
The Home Valuation Report is an in-depth analysis detailing your home's value as well as a comparison with similar homes in the area
Home Values in the Area
Average Home Value in this Area
Purchase History
| Date | Buyer | Sale Price | Title Company |
|---|---|---|---|
| Collyer Richard A | $680,000 | Commonwealth Title | |
| Wood Ronald W | $435,000 | North American Title Co | |
| Greenwald Hyun Ok | -- | -- |
Source: Public Records
Mortgage History
| Date | Status | Borrower | Loan Amount |
|---|---|---|---|
| Open | Collyer Richard A | $395,000 | |
| Previous Owner | Wood Ronald W | $348,000 | |
| Closed | Wood Ronald W | $43,500 | |
| Closed | Collyer Richard A | $100,000 |
Source: Public Records
Tax History Compared to Growth
Tax History
| Year | Tax Paid | Tax Assessment Tax Assessment Total Assessment is a certain percentage of the fair market value that is determined by local assessors to be the total taxable value of land and additions on the property. | Land | Improvement |
|---|---|---|---|---|
| 2025 | $11,962 | $984,844 | $493,869 | $490,975 |
| 2024 | $11,750 | $965,535 | $484,186 | $481,349 |
| 2023 | $11,750 | $946,604 | $474,693 | $471,911 |
| 2022 | $11,717 | $928,044 | $465,386 | $462,658 |
| 2021 | $11,525 | $909,848 | $456,261 | $453,587 |
| 2019 | $11,519 | $882,864 | $442,729 | $440,135 |
| 2018 | $11,115 | $865,554 | $434,049 | $431,505 |
| 2017 | $10,778 | $848,584 | $425,539 | $423,045 |
| 2016 | $10,523 | $831,946 | $417,196 | $414,750 |
| 2015 | $10,439 | $819,451 | $410,930 | $408,521 |
| 2014 | $9,724 | $752,500 | $377,356 | $375,144 |
Source: Public Records
Map
Nearby Homes
- 3902 Coyote Cir
- 1221 Buckeye Terrace
- 1923 Eagle Peak Ave
- 1921 Eagle Peak Ave Unit 28
- 1398 Shell Ln
- 337 Saclan Terrace
- 117 Crow Place
- 1295 Shell Cir Unit 1
- 1731 Indian Wells Way
- 1343 Shell Ln
- 1338 Shell Ln
- 1280 Shell Cir
- 1039 Feather Cir
- 814 Chert Place
- 1183 Shell Ln
- 415 Chupcan Place Unit 3
- 5516 Langford Ct
- 1816 Eagle Peak Ave
- 7016 Molluk Way
- 1105 Peacock Creek Dr