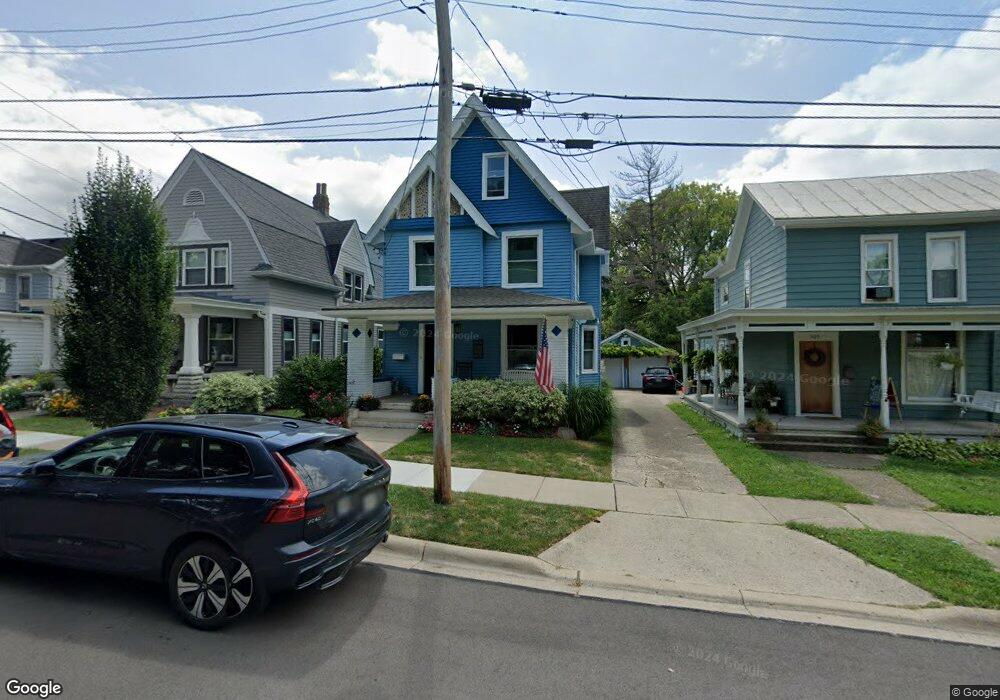
317 E Mulberry St Lebanon, OH 45036
Estimated Value: $244,000
2
Beds
2
Baths
1,484
Sq Ft
$164/Sq Ft
Est. Value
About This Home
This home is located at 317 E Mulberry St, Lebanon, OH 45036 and is currently priced at $244,000, approximately $164 per square foot. 317 E Mulberry St is a home located in Warren County with nearby schools including Bowman Primary School, Berry Intermediate School, and Donovan Elementary School.
Ownership History
Date
Name
Owned For
Owner Type
Purchase Details
Closed on
Mar 4, 2022
Sold by
Mcginty and Julie
Bought by
Mcginty Michael and Mcginty Julie
Current Estimated Value
Purchase Details
Closed on
Sep 7, 2017
Sold by
Bayes Dobbs Jacqueline N and Adkins Dennis
Bought by
Mcginty Michael and Mcginty Julie
Home Financials for this Owner
Home Financials are based on the most recent Mortgage that was taken out on this home.
Original Mortgage
$112,000
Interest Rate
3.9%
Mortgage Type
Future Advance Clause Open End Mortgage
Purchase Details
Closed on
Aug 11, 2004
Sold by
Bayes Jack L and Bayes Deana A
Bought by
Bayes Dobbs Jacqueline N
Home Financials for this Owner
Home Financials are based on the most recent Mortgage that was taken out on this home.
Original Mortgage
$77,000
Interest Rate
6.35%
Mortgage Type
Purchase Money Mortgage
Purchase Details
Closed on
Jan 29, 1985
Sold by
Gross Gross and Gross Bessie G
Bought by
Bayes Bayes and Bayes Jack L
Create a Home Valuation Report for This Property
The Home Valuation Report is an in-depth analysis detailing your home's value as well as a comparison with similar homes in the area
Home Values in the Area
Average Home Value in this Area
Purchase History
| Date | Buyer | Sale Price | Title Company |
|---|---|---|---|
| Mcginty Michael | -- | Ruffolo John M | |
| Mcginty Michael | -- | None Available | |
| Bayes Dobbs Jacqueline N | $100,000 | -- | |
| Bayes Bayes | $39,500 | -- |
Source: Public Records
Mortgage History
| Date | Status | Borrower | Loan Amount |
|---|---|---|---|
| Previous Owner | Mcginty Michael | $112,000 | |
| Previous Owner | Bayes Dobbs Jacqueline N | $77,000 |
Source: Public Records
Tax History Compared to Growth
Tax History
| Year | Tax Paid | Tax Assessment Tax Assessment Total Assessment is a certain percentage of the fair market value that is determined by local assessors to be the total taxable value of land and additions on the property. | Land | Improvement |
|---|---|---|---|---|
| 2021 | $2,819 | $61,915 | $7,469 | $54,446 |
| 2020 | $2,713 | $50,337 | $6,073 | $44,265 |
| 2019 | $2,726 | $50,337 | $6,073 | $44,265 |
| 2018 | $2,137 | $46,039 | $6,073 | $39,967 |
| 2017 | $1,936 | $35,844 | $5,618 | $30,226 |
| 2016 | $1,959 | $35,844 | $5,618 | $30,226 |
| 2015 | $1,973 | $35,844 | $5,618 | $30,226 |
| 2014 | $1,920 | $33,500 | $5,250 | $28,250 |
| 2013 | $1,853 | $38,750 | $6,070 | $32,680 |
Source: Public Records
Map
Nearby Homes
- 441 Bethpage Way
- 429 Bethpage Way
- 437 Bethpage Way Unit 7-303
- 429 Bethpage Way Unit 7-203
- 425 Bethpage Way Unit 7-202
- 401 Bethpage Way Unit 7-201
- 441 Bethpage Way Unit 7-305
- N Ohio 123
- Lot Ohio 123
- 324 E Warren St
- 417 E Warren St
- 440 E Main St
- 4377 Waters Edge Ln
- 16 Mound St
- 463 Valhalla Ct Unit 9-202
- 513 E Warren St
- 320 N Mechanic St
- 17 W Silver St
- 206 Wright Ave
- 10 N Sycamore St