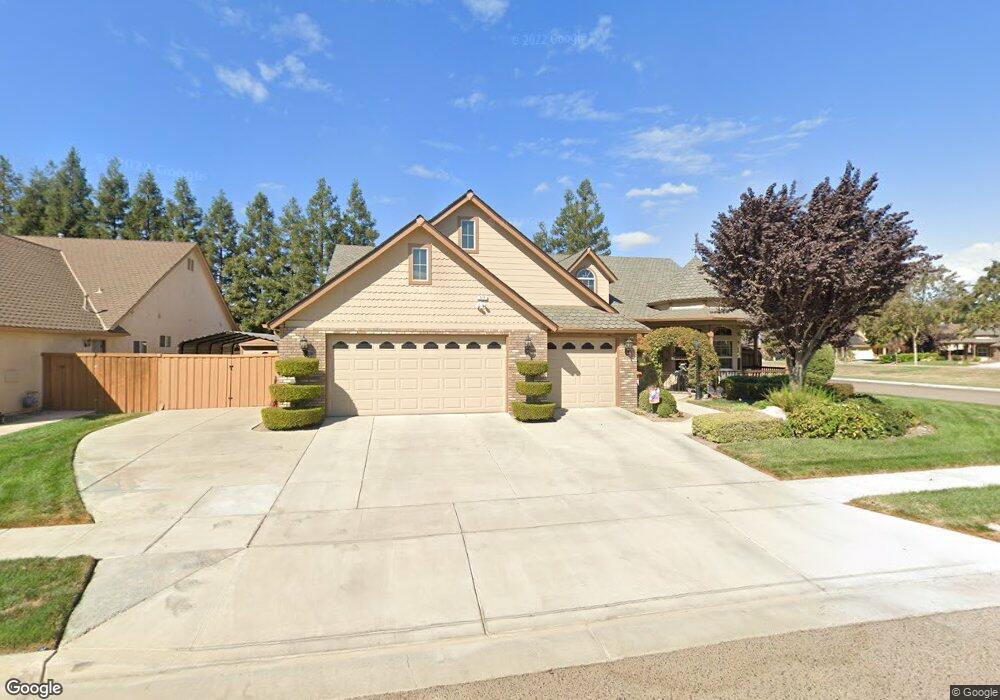
317 N Denton Ct Visalia, CA 93291
Northwest Visalia NeighborhoodEstimated Value: $661,000 - $797,000
3
Beds
3
Baths
2,507
Sq Ft
$287/Sq Ft
Est. Value
About This Home
This home is located at 317 N Denton Ct, Visalia, CA 93291 and is currently estimated at $720,451, approximately $287 per square foot. 317 N Denton Ct is a home located in Tulare County with nearby schools including Hurley Elementary School, Ridgeview Middle, and Redwood High School.
Ownership History
Date
Name
Owned For
Owner Type
Purchase Details
Closed on
Aug 1, 2024
Sold by
Scalia Giuseppe J and Scalia Guiseppe Joe
Bought by
Scalia Family Revocable Trust and Scalia
Current Estimated Value
Purchase Details
Closed on
Jan 3, 2014
Sold by
Deniz John A
Bought by
Scalia Guiseppe Joe and Scalia Norma Jean
Purchase Details
Closed on
Jul 27, 2005
Sold by
Stoffel Greg
Bought by
Deniz John A and Deniz Suzanne
Purchase Details
Closed on
Jan 1, 2005
Sold by
Lennar Fresno Inc
Bought by
Stoffel Greg and Stoffel Connie
Home Financials for this Owner
Home Financials are based on the most recent Mortgage that was taken out on this home.
Original Mortgage
$302,000
Interest Rate
5.25%
Mortgage Type
Purchase Money Mortgage
Create a Home Valuation Report for This Property
The Home Valuation Report is an in-depth analysis detailing your home's value as well as a comparison with similar homes in the area
Home Values in the Area
Average Home Value in this Area
Purchase History
| Date | Buyer | Sale Price | Title Company |
|---|---|---|---|
| Scalia Family Revocable Trust | -- | None Listed On Document | |
| Scalia Guiseppe Joe | $405,000 | Chicago Title Company | |
| Deniz John A | $595,000 | Chicago Title Co | |
| Stoffel Greg | $378,000 | North American Title Co |
Source: Public Records
Mortgage History
| Date | Status | Borrower | Loan Amount |
|---|---|---|---|
| Previous Owner | Stoffel Greg | $302,000 |
Source: Public Records
Tax History
| Year | Tax Paid | Tax Assessment Tax Assessment Total Assessment is a certain percentage of the fair market value that is determined by local assessors to be the total taxable value of land and additions on the property. | Land | Improvement |
|---|---|---|---|---|
| 2025 | $5,890 | $520,966 | $85,805 | $435,161 |
| 2024 | $5,890 | $510,752 | $84,123 | $426,629 |
| 2023 | $5,717 | $500,738 | $82,474 | $418,264 |
| 2022 | $5,460 | $490,920 | $80,857 | $410,063 |
| 2021 | $5,444 | $481,295 | $79,272 | $402,023 |
| 2020 | $5,398 | $476,360 | $78,459 | $397,901 |
| 2019 | $5,217 | $467,020 | $76,921 | $390,099 |
| 2018 | $5,093 | $457,863 | $75,413 | $382,450 |
| 2017 | $4,755 | $425,000 | $90,000 | $335,000 |
| 2016 | $4,426 | $395,000 | $95,000 | $300,000 |
| 2015 | $3,406 | $433,492 | $71,399 | $362,093 |
| 2014 | $3,406 | $305,000 | $76,000 | $229,000 |
Source: Public Records
Map
Nearby Homes
- 239 N Preston St
- 302 N Denton Ct
- 321 N Preston St
- 707 N Branson Ct
- 415 N Akers St Unit 94
- 415 N Akers St Unit 145
- 415 N Akers St Unit 47
- 415 N Akers St Unit 104
- 415 N Akers St Unit 121
- 703 N Shirk Rd
- 415 N Akers St Unit 126
- 415 N Akers St Unit 17
- 415 N Akers St Unit 84
- 845 N Michelle St Unit 1 Sr
- 825 N Michelle St
- 845 N Michelle St
- 805 N Michelle St
- 835 N Michelle St
- 805 N Michelle St Unit 5 Sr
- 835 N Michelle St Unit 2 Sr
- 301 N Denton Ct
- 318 N Marcin Ct
- 304 N Marcin Ct
- 245 N Denton Ct
- 316 N Denton Ct
- 302 N Denton Ct Unit 103
- 242 N Marcin Ct
- 240 N Denton Ct
- 233 N Denton Ct
- 230 N Marcin Ct
- 232 N Denton Ct
- 6408 W Logan Ave
- 319 N Marcin Ct
- 6420 W Logan Ave
- 223 N Denton Ct
- 305 N Marcin Ct
- 247 N Preston St
- 6432 W Logan Ave
- 220 N Denton Ct
- 224 N Marcin Ct
Your Personal Tour Guide
Ask me questions while you tour the home.