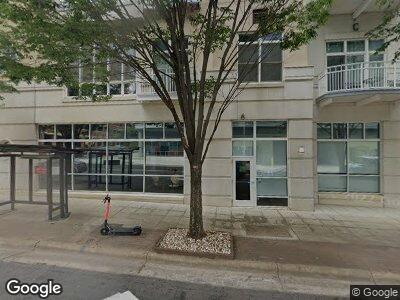
The Dawson 317 W Morgan St Unit 407 Raleigh, NC 27601
Warehouse District NeighborhoodEstimated Value: $452,299 - $553,000
2
Beds
2
Baths
1,149
Sq Ft
$436/Sq Ft
Est. Value
About This Home
This home is located at 317 W Morgan St Unit 407, Raleigh, NC 27601 and is currently estimated at $501,325, approximately $436 per square foot. 317 W Morgan St Unit 407 is a home located in Wake County with nearby schools including Wiley Elementary, Oberlin Middle School, and Broughton Magnet High School.
Ownership History
Date
Name
Owned For
Owner Type
Purchase Details
Closed on
Dec 9, 2019
Sold by
Rice Steven Andrew and Rice Therese Louise
Bought by
Kenney Stephen A
Current Estimated Value
Home Financials for this Owner
Home Financials are based on the most recent Mortgage that was taken out on this home.
Original Mortgage
$356,250
Outstanding Balance
$318,300
Interest Rate
3.75%
Mortgage Type
New Conventional
Estimated Equity
$183,025
Purchase Details
Closed on
Jun 12, 2014
Sold by
Rice Steven Andrew and Rice Therese Louise
Bought by
Rice Steven Andrew
Purchase Details
Closed on
Nov 23, 2012
Sold by
Carlucci Emily J and Cody Michael R
Bought by
Federal National Mortgage Association
Purchase Details
Closed on
Apr 11, 2005
Sold by
Dawson Developers Inc
Bought by
Penkowski Kenneth R
Home Financials for this Owner
Home Financials are based on the most recent Mortgage that was taken out on this home.
Original Mortgage
$223,537
Interest Rate
5.75%
Mortgage Type
Fannie Mae Freddie Mac
Create a Home Valuation Report for This Property
The Home Valuation Report is an in-depth analysis detailing your home's value as well as a comparison with similar homes in the area
Home Values in the Area
Average Home Value in this Area
Purchase History
| Date | Buyer | Sale Price | Title Company |
|---|---|---|---|
| Kenney Stephen A | $375,000 | None Available | |
| Rice Steven Andrew | -- | None Available | |
| Rice Stephen Andrew | $276,392 | None Available | |
| Federal National Mortgage Association | -- | None Available | |
| Penkowski Kenneth R | $235,500 | -- |
Source: Public Records
Mortgage History
| Date | Status | Borrower | Loan Amount |
|---|---|---|---|
| Open | Kenney Stephen A | $356,250 | |
| Previous Owner | Penkowski Kenneth R | $250,000 | |
| Previous Owner | Penkowski Kenneth R | $47,000 | |
| Previous Owner | Penkowski Kenneth R | $223,537 |
Source: Public Records
Tax History Compared to Growth
Tax History
| Year | Tax Paid | Tax Assessment Tax Assessment Total Assessment is a certain percentage of the fair market value that is determined by local assessors to be the total taxable value of land and additions on the property. | Land | Improvement |
|---|---|---|---|---|
| 2024 | $4,158 | $441,854 | $0 | $441,854 |
| 2023 | $10,529 | $370,433 | $0 | $370,433 |
| 2022 | $9,832 | $370,433 | $0 | $370,433 |
| 2021 | $3,787 | $370,433 | $0 | $370,433 |
| 2020 | $3,721 | $370,433 | $0 | $370,433 |
| 2019 | $3,669 | $298,675 | $0 | $298,675 |
| 2018 | $3,471 | $298,675 | $0 | $298,675 |
| 2017 | $3,315 | $298,675 | $0 | $298,675 |
| 2016 | $3,251 | $298,675 | $0 | $298,675 |
| 2015 | -- | $321,176 | $0 | $321,176 |
| 2014 | -- | $321,176 | $0 | $321,176 |
Source: Public Records
About The Dawson
Map
Nearby Homes
- 317 W Morgan St Unit 320
- 317 W Morgan St Unit 317
- 317 W Morgan St Unit 405
- 200 S Dawson St Unit 406
- 405 Starrett Ct
- 320 W Martin St Unit 205
- 122 N Harrington St Unit 775
- 122 N Harrington St Unit 1105
- 122 N Harrington St Unit 1025
- 222 Glenwood Ave Unit 714
- 222 Glenwood Ave Unit 218
- 222 Glenwood Ave Unit 608
- 222 Glenwood Ave Unit 602
- 222 Glenwood Ave Unit 508
- 222 Glenwood Ave Unit 307
- 710 Independence Place Unit 103
- 301 Fayetteville St Unit 3205
- 301 Fayetteville St Unit 2505
- 319 Fayetteville St Unit 404
- 319 Fayetteville St Unit 207
- 317 W Morgan St
- 317 W Morgan St Unit 407
- 317 W Morgan St Unit 313
- 317 W Morgan St Unit 326
- 317 W Morgan St Unit 324
- 317 W Morgan St Unit 302
- 317 W Morgan St Unit 226
- 317 W Morgan St Unit 224
- 317 W Morgan St Unit 202
- 317 W Morgan St Unit 200-1
- 317 W Morgan St Unit 515
- 317 W Morgan St Unit 512
- 317 W Morgan St Unit 511
- 317 W Morgan St Unit 510
- 317 W Morgan St Unit 509
- 317 W Morgan St Unit 508
- 317 W Morgan St Unit 507
- 317 W Morgan St Unit 506
- 317 W Morgan St Unit 505
- 317 W Morgan St Unit 504