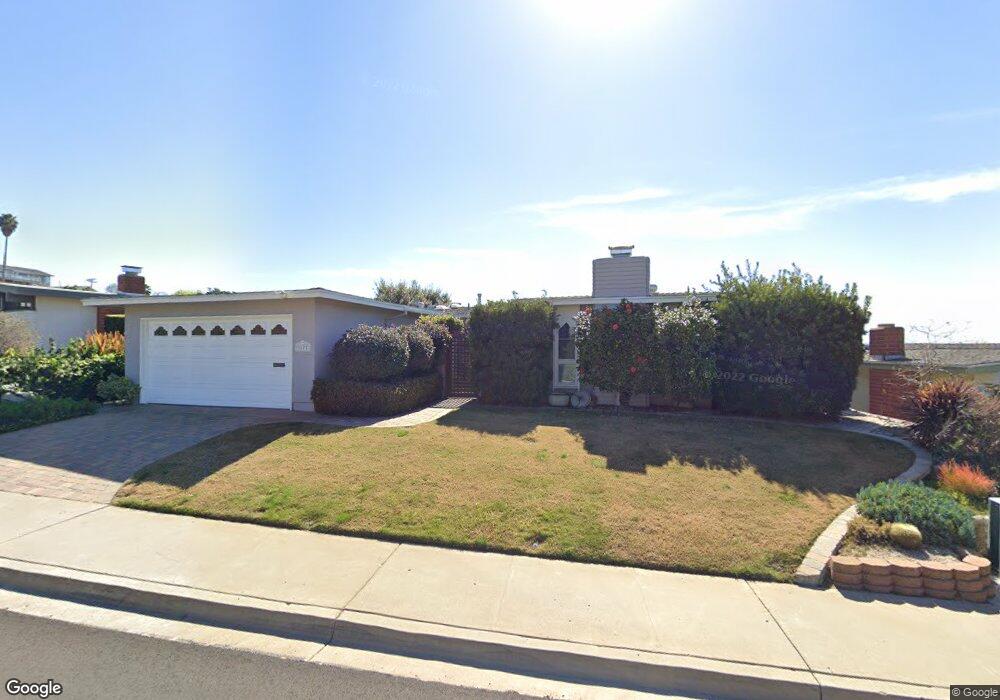
3177 Fryden Ct San Diego, CA 92117
Bay Ho NeighborhoodEstimated Value: $1,162,726 - $1,532,000
3
Beds
2
Baths
1,556
Sq Ft
$893/Sq Ft
Est. Value
About This Home
This home is located at 3177 Fryden Ct, San Diego, CA 92117 and is currently estimated at $1,388,932, approximately $892 per square foot. 3177 Fryden Ct is a home located in San Diego County with nearby schools including Cadman Elementary School, Marston Middle School, and Clairemont High School.
Ownership History
Date
Name
Owned For
Owner Type
Purchase Details
Closed on
Apr 6, 2020
Sold by
Carroll Gregory D
Bought by
Carroll Gregory D and Carroll Tricia M
Current Estimated Value
Home Financials for this Owner
Home Financials are based on the most recent Mortgage that was taken out on this home.
Original Mortgage
$510,400
Interest Rate
3.4%
Mortgage Type
New Conventional
Purchase Details
Closed on
Mar 3, 2020
Sold by
Carroll John B and Carroll John Charles
Bought by
Carroll Gregory D
Home Financials for this Owner
Home Financials are based on the most recent Mortgage that was taken out on this home.
Original Mortgage
$510,400
Interest Rate
3.4%
Mortgage Type
New Conventional
Purchase Details
Closed on
Oct 14, 1999
Sold by
Carroll John C and Carroll Carol A
Bought by
Carroll John Charles and Carroll Carol Ann
Create a Home Valuation Report for This Property
The Home Valuation Report is an in-depth analysis detailing your home's value as well as a comparison with similar homes in the area
Home Values in the Area
Average Home Value in this Area
Purchase History
| Date | Buyer | Sale Price | Title Company |
|---|---|---|---|
| Carroll Gregory D | -- | Lawyers Title Sd | |
| Carroll Gregory D | -- | None Available | |
| Carroll John Charles | -- | -- | |
| Carroll John Charles | -- | -- |
Source: Public Records
Mortgage History
| Date | Status | Borrower | Loan Amount |
|---|---|---|---|
| Closed | Carroll Gregory D | $510,400 |
Source: Public Records
Tax History Compared to Growth
Tax History
| Year | Tax Paid | Tax Assessment Tax Assessment Total Assessment is a certain percentage of the fair market value that is determined by local assessors to be the total taxable value of land and additions on the property. | Land | Improvement |
|---|---|---|---|---|
| 2025 | $986 | $86,114 | $25,610 | $60,504 |
| 2024 | $986 | $84,426 | $25,108 | $59,318 |
| 2023 | $962 | $82,771 | $24,616 | $58,155 |
| 2022 | $935 | $81,149 | $24,134 | $57,015 |
| 2021 | $927 | $79,559 | $23,661 | $55,898 |
| 2020 | $1,001 | $78,744 | $23,419 | $55,325 |
| 2019 | $898 | $77,201 | $22,960 | $54,241 |
| 2018 | $839 | $75,688 | $22,510 | $53,178 |
| 2017 | $818 | $74,205 | $22,069 | $52,136 |
| 2016 | $802 | $72,751 | $21,637 | $51,114 |
| 2015 | $789 | $71,659 | $21,312 | $50,347 |
| 2014 | $776 | $70,256 | $20,895 | $49,361 |
Source: Public Records
Map
Nearby Homes
- 3129 Driscoll Dr
- 4135 Huerfano Ave
- 3001 Hartman Way
- 4060 Huerfano Ave Unit 125
- 4060 Huerfano Ave Unit 240
- 4060 Huerfano Ave Unit 109
- 4060 Huerfano Ave Unit 126
- 4048 Raffee Dr
- 3212 Cadden Ct
- 4010 Paducah Dr
- 3701 Tavara Cir
- 3903 Cadden Way
- 4543 Moraga Ave
- 3360 Hopi Place
- 3571 Idlewild Way
- 4354-56 Clairemont Dr
- 3341 Cadden Dr
- 3375 Karok Ave
- 3719 Balboa Terrace Unit A
- 4193 Datcho Dr
- 3169 Fryden Ct
- 3185 Fryden Ct
- 3161 Fryden Ct
- 3193 Fryden Ct
- 3183 Brillden Ct
- 3173 Driscoll Dr
- 3171 Brillden Ct
- 3185 Driscoll Dr
- 3165 Driscoll Dr
- 3191 Brillden Ct
- 3151 Fryden Ct
- 3163 Brillden Ct
- 4242 Avati Dr
- 3199 Fryden Ct
- 3159 Driscoll Dr
- 4256 Avati Dr
- 4192 Avati Dr
- 3149 Brillden Ct
- 3151 Driscoll Dr
- 3199 Brillden Ct