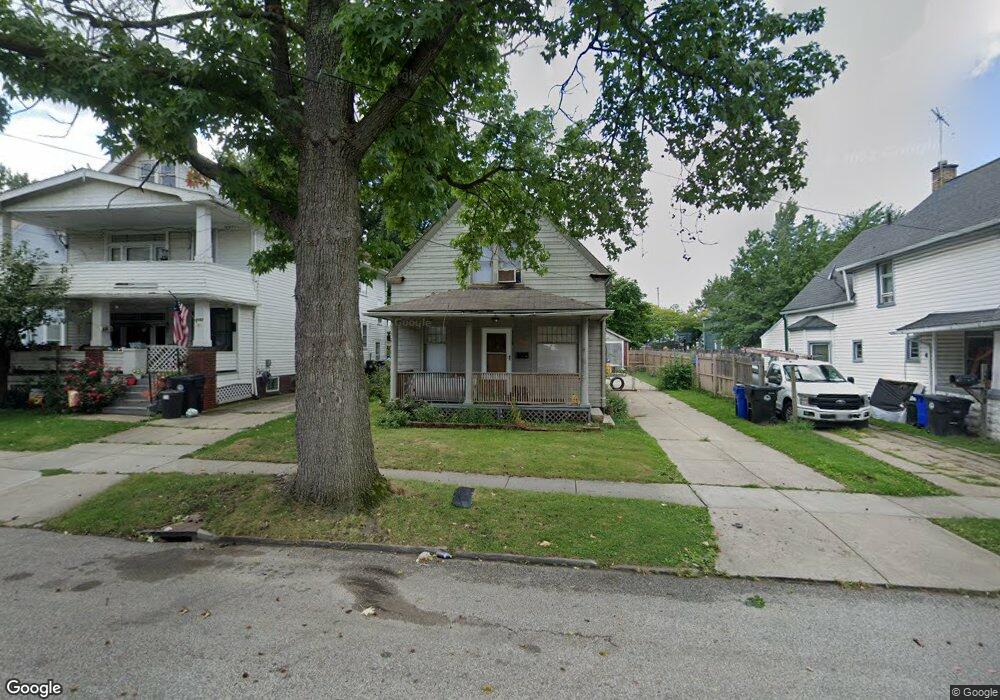
3178 W 92nd St Cleveland, OH 44102
West Boulevard NeighborhoodEstimated Value: $119,118 - $130,000
3
Beds
2
Baths
1,413
Sq Ft
$87/Sq Ft
Est. Value
About This Home
This home is located at 3178 W 92nd St, Cleveland, OH 44102 and is currently estimated at $123,530, approximately $87 per square foot. 3178 W 92nd St is a home located in Cuyahoga County with nearby schools including Almira Academy, Artemus Ward School, and Anton Grdina School.
Ownership History
Date
Name
Owned For
Owner Type
Purchase Details
Closed on
Mar 13, 2017
Sold by
Moose James
Bought by
Balducci Christopher
Current Estimated Value
Purchase Details
Closed on
Dec 7, 2016
Sold by
Piezhala Samantha L
Bought by
Moore James
Purchase Details
Closed on
Jan 19, 2016
Sold by
Thompson Angela L
Bought by
Pierzchala Samantha L
Purchase Details
Closed on
Mar 28, 2011
Sold by
Key Gary
Bought by
Thompson Angela L and Thompson Joshua J
Purchase Details
Closed on
Feb 13, 2007
Sold by
Key Gary and Key Stephanie C
Bought by
Key Gary
Purchase Details
Closed on
Mar 30, 1993
Sold by
Winemiller Karen S
Bought by
Winemiller Karen S
Purchase Details
Closed on
Sep 15, 1992
Sold by
Winemiller Charles A and Winemiller Karen
Bought by
Winemiller Karen S
Purchase Details
Closed on
Nov 23, 1983
Sold by
Ellis Irene
Bought by
Winemiller Charles A and Winemiller Karen
Purchase Details
Closed on
Dec 20, 1982
Sold by
Dorothy R Smith
Bought by
Ellis Irene
Purchase Details
Closed on
Jan 1, 1975
Bought by
Smith Dorothy R
Create a Home Valuation Report for This Property
The Home Valuation Report is an in-depth analysis detailing your home's value as well as a comparison with similar homes in the area
Home Values in the Area
Average Home Value in this Area
Purchase History
| Date | Buyer | Sale Price | Title Company |
|---|---|---|---|
| Balducci Christopher | $39,200 | None Available | |
| Moore James | $39,200 | None Available | |
| Pierzchala Samantha L | $7,000 | Attorney | |
| Thompson Angela L | $7,000 | None Available | |
| Key Gary | -- | Attorney | |
| Winemiller Karen S | -- | -- | |
| Winemiller Karen S | -- | -- | |
| Winemiller Charles A | $27,000 | -- | |
| Ellis Irene | $17,500 | -- | |
| Dorothy R Smith | -- | -- | |
| Smith Dorothy R | -- | -- |
Source: Public Records
Tax History Compared to Growth
Tax History
| Year | Tax Paid | Tax Assessment Tax Assessment Total Assessment is a certain percentage of the fair market value that is determined by local assessors to be the total taxable value of land and additions on the property. | Land | Improvement |
|---|---|---|---|---|
| 2024 | $1,741 | $26,040 | $7,280 | $18,760 |
| 2023 | $1,205 | $15,550 | $3,680 | $11,870 |
| 2022 | $1,199 | $15,540 | $3,680 | $11,870 |
| 2021 | $1,884 | $15,540 | $3,680 | $11,870 |
| 2020 | $1,058 | $11,970 | $2,840 | $9,140 |
| 2019 | $980 | $34,200 | $8,100 | $26,100 |
| 2018 | $1,050 | $11,970 | $2,840 | $9,140 |
| 2017 | $1,161 | $13,730 | $3,260 | $10,470 |
| 2016 | $1,123 | $13,730 | $3,260 | $10,470 |
| 2015 | $6,905 | $13,730 | $3,260 | $10,470 |
| 2014 | $5,175 | $15,230 | $3,610 | $11,620 |
Source: Public Records
Map
Nearby Homes
- 3197 W 90th St
- 3235 W 94th St
- 3153 W 88th St
- 9510 Denison Ave
- 3211 W 86th St
- 3288 W 91st St
- 3305 W 97th St
- 3147 W 84th St
- 3303 W 90th St
- 3118 W 82nd St
- 3181 W 82nd St
- 3325 W 98th St
- 3281 W 99th St
- 3355 W 91st St
- 2222 W 98th St
- 9414 Almira Ave
- 8016 Halle Ave
- 3296 W 99th St
- 3342 W 84th St
- 3372 W 90th St