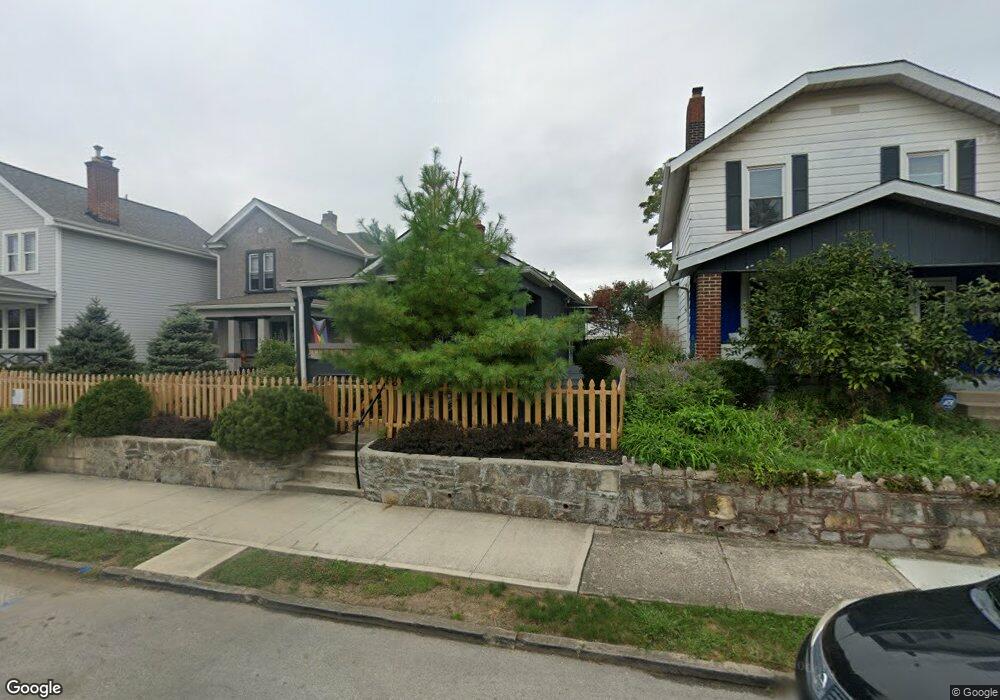
318 E Hinman Ave Columbus, OH 43207
Reeb-Hosack/Hungarian Village NeighborhoodEstimated Value: $162,000 - $218,000
2
Beds
2
Baths
720
Sq Ft
$265/Sq Ft
Est. Value
About This Home
This home is located at 318 E Hinman Ave, Columbus, OH 43207 and is currently estimated at $190,931, approximately $265 per square foot. 318 E Hinman Ave is a home located in Franklin County with nearby schools including Southwood Elementary School, South High School, and South Columbus Preparatory Academy.
Ownership History
Date
Name
Owned For
Owner Type
Purchase Details
Closed on
Jan 16, 2004
Sold by
Lyons Kevin R
Bought by
Parsons Timothy and Tubaugh Charles J
Current Estimated Value
Home Financials for this Owner
Home Financials are based on the most recent Mortgage that was taken out on this home.
Original Mortgage
$67,925
Interest Rate
7.85%
Mortgage Type
Purchase Money Mortgage
Purchase Details
Closed on
Nov 30, 1999
Sold by
Yarber Ruth E and Estate Of Jesse D Karr
Bought by
Lyons Kevin R
Home Financials for this Owner
Home Financials are based on the most recent Mortgage that was taken out on this home.
Original Mortgage
$47,250
Interest Rate
7.97%
Purchase Details
Closed on
Aug 18, 1999
Sold by
Estate Of Juanita M Karr
Bought by
Karr Jesse D
Purchase Details
Closed on
Apr 12, 1973
Bought by
Karr Jesse D
Create a Home Valuation Report for This Property
The Home Valuation Report is an in-depth analysis detailing your home's value as well as a comparison with similar homes in the area
Home Values in the Area
Average Home Value in this Area
Purchase History
| Date | Buyer | Sale Price | Title Company |
|---|---|---|---|
| Parsons Timothy | $71,500 | -- | |
| Lyons Kevin R | $52,500 | Capcity Title | |
| Karr Jesse D | -- | Independent Title | |
| Karr Jesse D | -- | -- |
Source: Public Records
Mortgage History
| Date | Status | Borrower | Loan Amount |
|---|---|---|---|
| Previous Owner | Parsons Timothy | $67,925 | |
| Previous Owner | Lyons Kevin R | $47,250 |
Source: Public Records
Tax History Compared to Growth
Tax History
| Year | Tax Paid | Tax Assessment Tax Assessment Total Assessment is a certain percentage of the fair market value that is determined by local assessors to be the total taxable value of land and additions on the property. | Land | Improvement |
|---|---|---|---|---|
| 2024 | $2,671 | $59,510 | $19,220 | $40,290 |
| 2023 | $2,761 | $62,300 | $19,215 | $43,085 |
| 2022 | $1,923 | $37,070 | $10,780 | $26,290 |
| 2021 | $1,926 | $37,070 | $10,780 | $26,290 |
| 2020 | $1,929 | $37,070 | $10,780 | $26,290 |
| 2019 | $1,614 | $26,600 | $7,980 | $18,620 |
| 2018 | $1,468 | $26,600 | $7,980 | $18,620 |
| 2017 | $1,537 | $26,600 | $7,980 | $18,620 |
| 2016 | $1,461 | $22,050 | $5,460 | $16,590 |
| 2015 | $1,326 | $22,050 | $5,460 | $16,590 |
| 2014 | $1,329 | $22,050 | $5,460 | $16,590 |
| 2013 | $729 | $24,500 | $6,055 | $18,445 |
Source: Public Records
Map
Nearby Homes
- 332 E Hinman Ave
- 314 E Woodrow Ave
- 255 E Woodrow Ave
- 1696 Parsons Ave
- 1692 Parsons Ave
- 1613 S 8th St
- 1756 Bruck St
- 1676 Parsons Ave
- 386 E Welch Ave
- 457 E Woodrow Ave Unit 459
- 464 E Hinman Ave
- 472 E Hinman Ave
- 466 E Morrill Ave
- 480-482 E Morrill Ave
- 220 E Welch Ave
- 495 E Welch Ave
- 361-363 Southwood Ave
- 292 E Barthman Ave
- 1808 S 6th St Unit 810
- 323 Southwood Ave
- 322 E Hinman Ave
- 310 E Hinman Ave
- 326 E Hinman Ave
- 306 E Hinman Ave
- 334 E Hinman Ave
- 0 E Hinman Ave
- 300 E Hinman Ave
- 321 E Morrill Ave
- 317 E Morrill Ave
- 325 E Morrill Ave
- 338 E Hinman Ave
- 313 E Morrill Ave
- 329 E Morrill Ave
- 333 E Morrill Ave
- 309 E Morrill Ave
- 294 E Hinman Ave
- 315 E Hinman Ave
- 311 E Hinman Ave
- 319 E Hinman Ave
- 342 E Hinman Ave