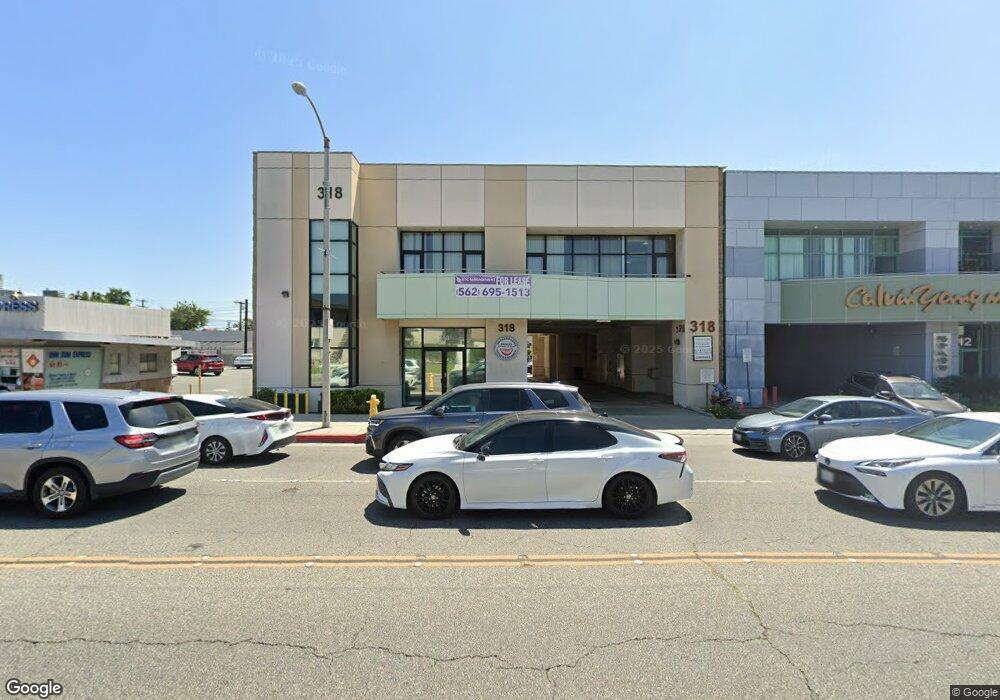
318 N Garfield Ave Unit A (2nd) Monterey Park, CA 91754
4
Beds
2
Baths
8,260
Sq Ft
0.4
Acres
About This Home
This home is located at 318 N Garfield Ave Unit A (2nd), Monterey Park, CA 91754. 318 N Garfield Ave Unit A (2nd) is a home located in Los Angeles County with nearby schools including Ynez Elementary School, Mark Keppel High School, and Options for Youth San Gabriel School.
Ownership History
Date
Name
Owned For
Owner Type
Purchase Details
Closed on
Dec 16, 2012
Sold by
Chen Melissa H
Bought by
Chen Christopher and Chen Clark
Purchase Details
Closed on
Mar 19, 2008
Sold by
Chen Howard and Chen Melissa
Bought by
Chenand Howard Y and Chen Melissa H
Purchase Details
Closed on
Feb 22, 2007
Sold by
Magnus Sunhill Group Llc
Bought by
Chen Howard and Chen Melissa
Purchase Details
Closed on
Nov 16, 2006
Sold by
Mildred Properties Llc
Bought by
Carter Roger C and Carter Maureen C
Purchase Details
Closed on
Jul 19, 2006
Sold by
Lai Ivy
Bought by
Lau Si and Lau Kitty
Home Financials for this Owner
Home Financials are based on the most recent Mortgage that was taken out on this home.
Original Mortgage
$2,520,000
Interest Rate
6.76%
Mortgage Type
Commercial
Create a Home Valuation Report for This Property
The Home Valuation Report is an in-depth analysis detailing your home's value as well as a comparison with similar homes in the area
Home Values in the Area
Average Home Value in this Area
Purchase History
| Date | Buyer | Sale Price | Title Company |
|---|---|---|---|
| Chen Christopher | -- | None Available | |
| Chen Christopher | -- | None Available | |
| Chen Howard Y | -- | None Available | |
| Chenand Howard Y | -- | None Available | |
| Chen Howard | $1,080,000 | Ticor Title Co Glendale | |
| Magnus Sunhill Group Llc | -- | Ticor Title Company | |
| Carter Roger C | -- | Ticor Title Company | |
| Lau Si | $3,600,000 | Ticor Title |
Source: Public Records
Mortgage History
| Date | Status | Borrower | Loan Amount |
|---|---|---|---|
| Previous Owner | Lau Si | $2,520,000 |
Source: Public Records
Tax History Compared to Growth
Tax History
| Year | Tax Paid | Tax Assessment Tax Assessment Total Assessment is a certain percentage of the fair market value that is determined by local assessors to be the total taxable value of land and additions on the property. | Land | Improvement |
|---|---|---|---|---|
| 2025 | $37,275 | $2,746,075 | $1,169,852 | $1,576,223 |
| 2024 | $37,275 | $2,692,231 | $1,146,914 | $1,545,317 |
| 2023 | $36,536 | $2,639,443 | $1,124,426 | $1,515,017 |
| 2022 | $34,849 | $2,587,690 | $1,102,379 | $1,485,311 |
| 2021 | $34,415 | $2,536,952 | $1,080,764 | $1,456,188 |
| 2019 | $33,212 | $2,461,707 | $1,048,709 | $1,412,998 |
| 2018 | $33,081 | $2,413,440 | $1,028,147 | $1,385,293 |
| 2016 | $30,541 | $2,319,725 | $988,224 | $1,331,501 |
| 2015 | $30,050 | $2,284,881 | $973,380 | $1,311,501 |
| 2014 | -- | $2,240,124 | $954,313 | $1,285,811 |
Source: Public Records
Map
Nearby Homes
- 215 N Lincoln Ave
- 406 N Lincoln Ave Unit A
- 305 N Baltimore Ave Unit C
- 215 W Garcelon Ave
- 223 E Emerson Ave
- 303 N Nicholson Ave Unit 308
- 197 N Nicholson Ave
- 203 N Nicholson Ave
- 230 N Nicholson Ave Unit C
- 208 N Nicholson Ave Unit B
- 522 N Nicholson Ave Unit A
- 522 N Nicholson Ave Unit A
- 433 N Alhambra Ave Unit C
- 123 N Alhambra Ave Unit D
- 2037 S 3rd St
- 513 W Emerson Ave Unit C
- 500 N Moore Ave Unit E
- 516 N Moore Ave Unit A
- 112 S Sierra Vista St
- 425 N Rural Dr
- 318 N Garfield Ave Unit E (2nd)
- 318 N Garfield Ave Unit B(2nd)
- 318 N Garfield Ave Unit D (2nd)
- 328 N Garfield Ave
- 302 N Garfield Ave
- 302 N Garfield Ave
- 302 N Garfield Ave Unit 3
- 302 N Garfield Ave Unit B5
- 230 N Garfield Ave
- 306 N Garfield Ave
- 304 N Garfield Ave Unit 3
- 304 N Garfield Ave
- 306 N Garfield Ave Unit 6
- 230 N Garfield Ave Unit 12
- 306 N Garfield Ave Unit 10
- 306 N Garfield Ave Unit 8
- 230 N Garfield Ave Unit 5
- 306 N Garfield Ave Unit 3
- 306 N Garfield Ave Unit A8
- 230 N Garfield Ave Unit 1