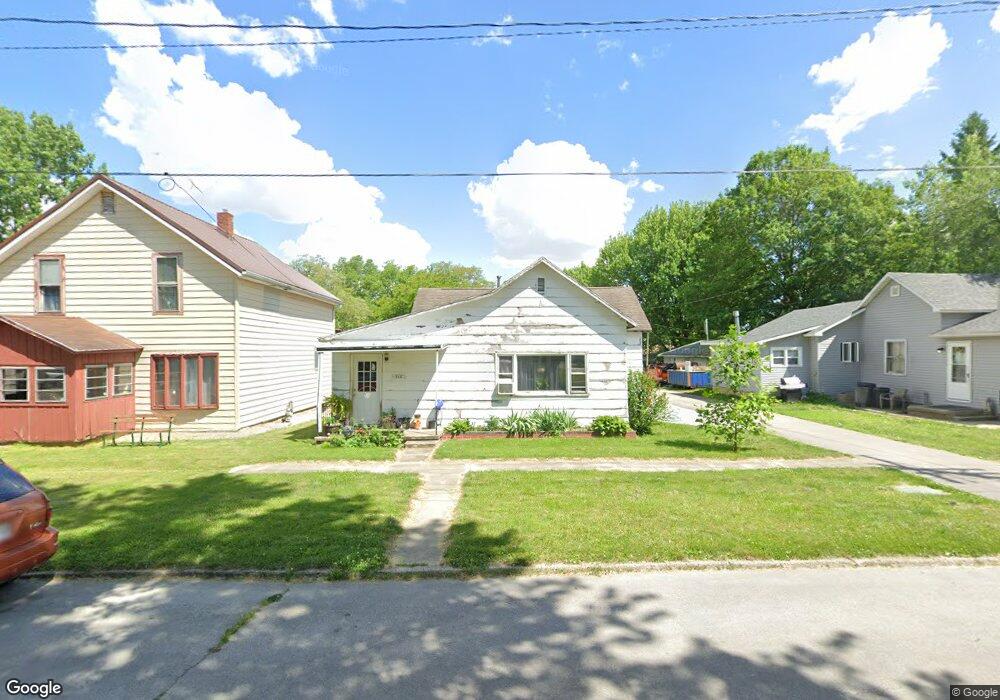
318 N Nancy St Warren, IN 46792
Estimated Value: $71,000 - $139,000
3
Beds
1
Bath
1,449
Sq Ft
$76/Sq Ft
Est. Value
About This Home
This home is located at 318 N Nancy St, Warren, IN 46792 and is currently estimated at $110,504, approximately $76 per square foot. 318 N Nancy St is a home located in Huntington County with nearby schools including Salamonie School and Huntington North High School.
Ownership History
Date
Name
Owned For
Owner Type
Purchase Details
Closed on
May 28, 2021
Sold by
Clark Brett J and Clark Amanda M
Bought by
Fisher Derek and Johnson Allison
Current Estimated Value
Home Financials for this Owner
Home Financials are based on the most recent Mortgage that was taken out on this home.
Original Mortgage
$23,000
Outstanding Balance
$17,347
Interest Rate
2.9%
Mortgage Type
Credit Line Revolving
Estimated Equity
$93,157
Purchase Details
Closed on
Jul 27, 2009
Sold by
Whg Third 72 Llc
Bought by
Clark Brett J and Clark Amanda Mae
Purchase Details
Closed on
Apr 7, 2009
Sold by
Entities Blue Spruce
Bought by
Whg Third 72 Llc
Purchase Details
Closed on
Apr 6, 2009
Sold by
Nationstar Mortgage Llc
Bought by
Blue Spruce Entities Llc
Purchase Details
Closed on
Mar 14, 2008
Sold by
Mccarver Beth A
Bought by
Nationstar Mortgage Llc and Centex Home Equity Company Llc
Create a Home Valuation Report for This Property
The Home Valuation Report is an in-depth analysis detailing your home's value as well as a comparison with similar homes in the area
Home Values in the Area
Average Home Value in this Area
Purchase History
| Date | Buyer | Sale Price | Title Company |
|---|---|---|---|
| Fisher Derek | -- | None Available | |
| Clark Brett J | -- | None Available | |
| Whg Third 72 Llc | $5,500 | Blue Spruce Entities Llc | |
| Whg Third 72 Llc | -- | None Available | |
| Blue Spruce Entities Llc | $1,500 | Blue Spruce Entities Llc | |
| Blue Spruce Entities Llc | -- | None Available | |
| Nationstar Mortgage Llc | $37,500 | None Available |
Source: Public Records
Mortgage History
| Date | Status | Borrower | Loan Amount |
|---|---|---|---|
| Open | Fisher Derek | $23,000 |
Source: Public Records
Tax History Compared to Growth
Tax History
| Year | Tax Paid | Tax Assessment Tax Assessment Total Assessment is a certain percentage of the fair market value that is determined by local assessors to be the total taxable value of land and additions on the property. | Land | Improvement |
|---|---|---|---|---|
| 2024 | $370 | $59,700 | $8,800 | $50,900 |
| 2023 | $324 | $50,800 | $8,800 | $42,000 |
| 2022 | $234 | $46,200 | $8,800 | $37,400 |
| 2021 | $228 | $43,000 | $8,800 | $34,200 |
| 2020 | $894 | $44,700 | $8,800 | $35,900 |
| 2019 | $782 | $39,100 | $8,800 | $30,300 |
| 2018 | $748 | $37,400 | $8,800 | $28,600 |
| 2017 | $740 | $37,000 | $8,800 | $28,200 |
| 2016 | $734 | $36,700 | $8,800 | $27,900 |
| 2014 | $706 | $35,300 | $8,800 | $26,500 |
| 2013 | $706 | $34,200 | $8,800 | $25,400 |
Source: Public Records
Map
Nearby Homes