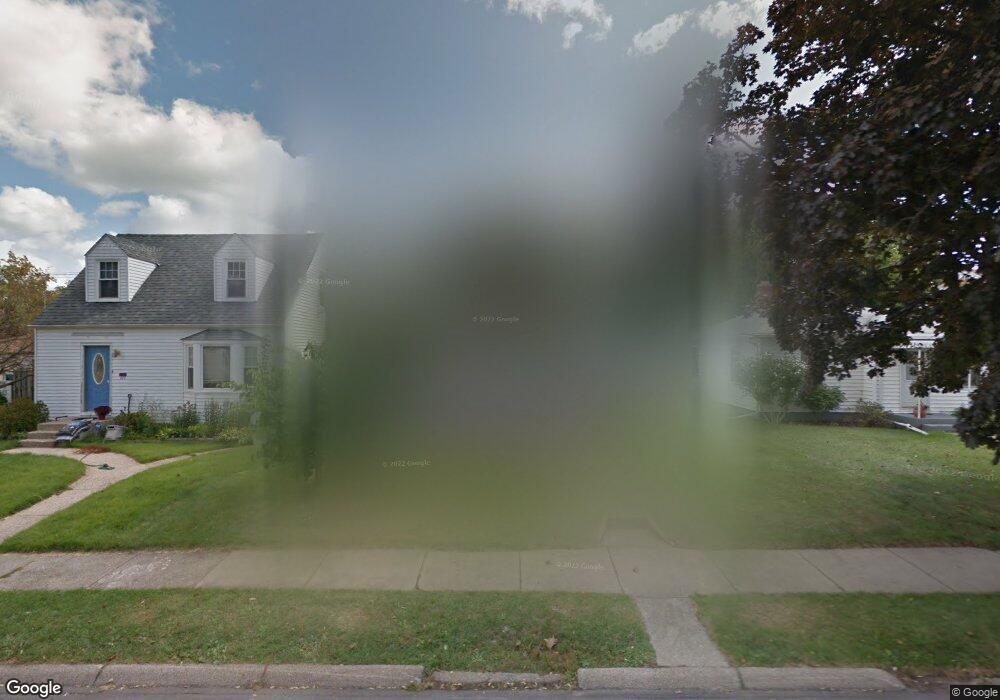
318 N Wenger Ave Mishawaka, IN 46544
Estimated Value: $169,000 - $214,000
4
Beds
1
Bath
1,936
Sq Ft
$99/Sq Ft
Est. Value
About This Home
This home is located at 318 N Wenger Ave, Mishawaka, IN 46544 and is currently estimated at $190,747, approximately $98 per square foot. 318 N Wenger Ave is a home located in St. Joseph County with nearby schools including Beiger Elementary School, John J. Young Middle School, and Mishawaka High School.
Ownership History
Date
Name
Owned For
Owner Type
Purchase Details
Closed on
Nov 17, 2016
Sold by
Adelsperger Douglas R
Bought by
Bonds Kimberly A
Current Estimated Value
Home Financials for this Owner
Home Financials are based on the most recent Mortgage that was taken out on this home.
Original Mortgage
$83,460
Outstanding Balance
$68,700
Interest Rate
4.25%
Mortgage Type
FHA
Estimated Equity
$122,047
Purchase Details
Closed on
Jun 28, 2011
Sold by
Kondaur Capital Corp
Bought by
5 Star Investment Group V Llc
Purchase Details
Closed on
May 12, 2006
Sold by
Heatherly Richard D and Heatherly Paulette F
Bought by
Woolet Joseph and Woolet Rebecca A
Home Financials for this Owner
Home Financials are based on the most recent Mortgage that was taken out on this home.
Original Mortgage
$71,760
Interest Rate
10.5%
Mortgage Type
Adjustable Rate Mortgage/ARM
Create a Home Valuation Report for This Property
The Home Valuation Report is an in-depth analysis detailing your home's value as well as a comparison with similar homes in the area
Home Values in the Area
Average Home Value in this Area
Purchase History
| Date | Buyer | Sale Price | Title Company |
|---|---|---|---|
| Bonds Kimberly A | -- | -- | |
| 5 Star Investment Group V Llc | -- | Lawyers Title | |
| Woolet Joseph | -- | None Available |
Source: Public Records
Mortgage History
| Date | Status | Borrower | Loan Amount |
|---|---|---|---|
| Open | Bonds Kimberly A | $83,460 | |
| Previous Owner | Woolet Joseph | $71,760 |
Source: Public Records
Tax History Compared to Growth
Tax History
| Year | Tax Paid | Tax Assessment Tax Assessment Total Assessment is a certain percentage of the fair market value that is determined by local assessors to be the total taxable value of land and additions on the property. | Land | Improvement |
|---|---|---|---|---|
| 2024 | $1,627 | $156,900 | $20,300 | $136,600 |
| 2023 | $1,610 | $142,900 | $20,300 | $122,600 |
| 2022 | $1,610 | $139,700 | $20,300 | $119,400 |
| 2021 | $1,366 | $119,300 | $10,000 | $109,300 |
| 2020 | $1,272 | $111,400 | $9,300 | $102,100 |
| 2019 | $1,220 | $106,900 | $8,900 | $98,000 |
| 2018 | $1,130 | $89,400 | $7,300 | $82,100 |
| 2017 | $1,180 | $88,800 | $7,300 | $81,500 |
| 2016 | $574 | $55,900 | $7,300 | $48,600 |
| 2014 | $1,484 | $54,900 | $7,300 | $47,600 |
Source: Public Records
Map
Nearby Homes
- 119 Niles Ave
- 904 Homewood Ave
- 1036 E 3rd St
- 214 N State St
- 1316 E Mishawaka Ave
- 453 Edgewater Dr
- 447 Edgewater Dr
- 1018 E 4th St
- 703 Maple St
- 355 Park Ave
- 909 E Lawrence St
- 901 E Lawrence St
- 1434 E 4th St
- 1015 E Broadway St
- 726 E 3rd St
- 1449 E 3rd St
- Lot 32 A Forest River Run
- 1521 Lincolnway E
- 806 E Lawrence St
- 629 E 3rd St
- 314 N Wenger Ave
- 322 N Wenger Ave
- 312 N Wenger Ave
- 330 N Wenger Ave
- 308 N Wenger Ave
- 317 Studebaker St
- 321 Studebaker St
- 315 Studebaker St
- 325 Studebaker St
- 309 Studebaker St
- 302 N Wenger Ave
- 332 N Wenger Ave
- 319 N Wenger Ave
- 321 N Wenger Ave
- 313 N Wenger Ave
- 305 Studebaker St
- 323 N Wenger Ave
- 309 N Wenger Ave
- 329 N Wenger Ave
- 301 Studebaker St