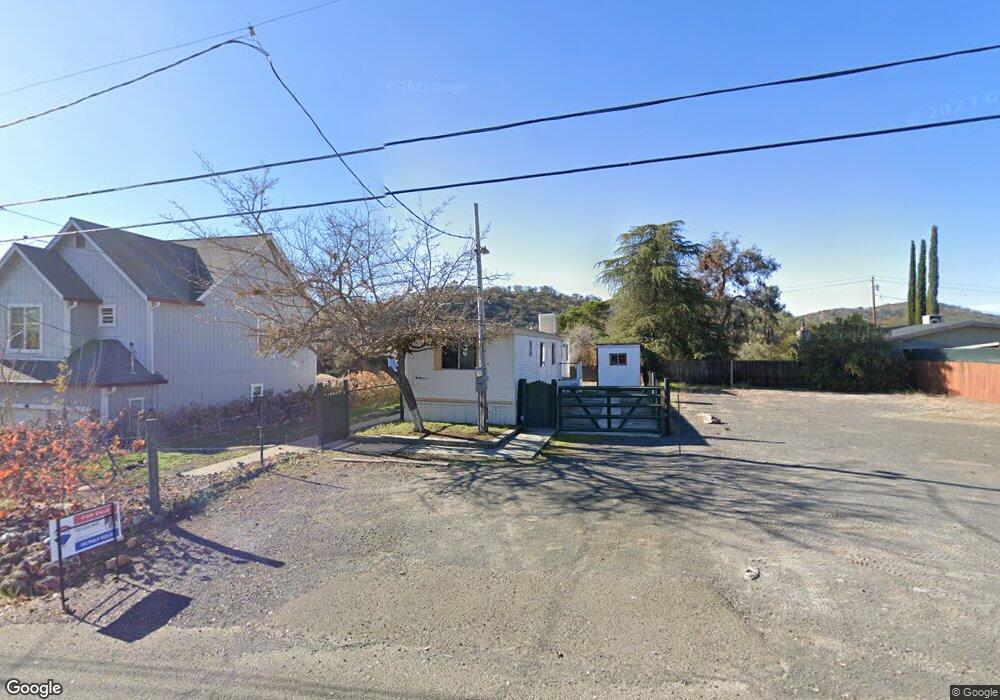
3183 11th St Clear Lake, CA 95422
Estimated Value: $68,963 - $149,000
2
Beds
2
Baths
950
Sq Ft
$109/Sq Ft
Est. Value
About This Home
This home is located at 3183 11th St, Clear Lake, CA 95422 and is currently estimated at $103,654, approximately $109 per square foot. 3183 11th St is a home located in Lake County with nearby schools including Lower Lake High School, Konocti Private School, and Grace Christian Academy, Clearlake Church of the Nazarene.
Ownership History
Date
Name
Owned For
Owner Type
Purchase Details
Closed on
Mar 7, 2024
Sold by
Lemings Wayne R
Bought by
Pate Donald F
Current Estimated Value
Purchase Details
Closed on
Jul 1, 2009
Sold by
Camp Dariel R
Bought by
Lemings Wayne R
Home Financials for this Owner
Home Financials are based on the most recent Mortgage that was taken out on this home.
Original Mortgage
$26,400
Interest Rate
4.79%
Mortgage Type
Seller Take Back
Purchase Details
Closed on
Jun 11, 2009
Sold by
Schankin Diane Lynn
Bought by
Lemings Wayne R
Home Financials for this Owner
Home Financials are based on the most recent Mortgage that was taken out on this home.
Original Mortgage
$26,400
Interest Rate
4.79%
Mortgage Type
Seller Take Back
Create a Home Valuation Report for This Property
The Home Valuation Report is an in-depth analysis detailing your home's value as well as a comparison with similar homes in the area
Purchase History
| Date | Buyer | Sale Price | Title Company |
|---|---|---|---|
| Pate Donald F | $69,500 | None Listed On Document | |
| Lemings Wayne R | $31,500 | Fidelity Natl Title Co Of Ca | |
| Lemings Wayne R | -- | Fidelity Natl Title Co Of Ca |
Source: Public Records
Mortgage History
| Date | Status | Borrower | Loan Amount |
|---|---|---|---|
| Previous Owner | Lemings Wayne R | $26,400 |
Source: Public Records
Tax History
| Year | Tax Paid | Tax Assessment Tax Assessment Total Assessment is a certain percentage of the fair market value that is determined by local assessors to be the total taxable value of land and additions on the property. | Land | Improvement |
|---|---|---|---|---|
| 2025 | $949 | $70,380 | $20,400 | $49,980 |
| 2024 | $608 | $39,848 | $25,303 | $14,545 |
| 2023 | $598 | $39,067 | $24,807 | $14,260 |
| 2022 | $567 | $38,302 | $24,321 | $13,981 |
| 2021 | $571 | $37,552 | $23,845 | $13,707 |
| 2020 | $568 | $37,168 | $23,601 | $13,567 |
| 2019 | $546 | $36,440 | $23,139 | $13,301 |
| 2018 | $544 | $35,727 | $22,686 | $13,041 |
| 2017 | $521 | $35,028 | $22,242 | $12,786 |
| 2016 | $443 | $34,342 | $21,806 | $12,536 |
| 2015 | -- | $33,827 | $21,479 | $12,348 |
| 2014 | $428 | $33,166 | $21,059 | $12,107 |
Source: Public Records
Map
Nearby Homes
Your Personal Tour Guide
Ask me questions while you tour the home.