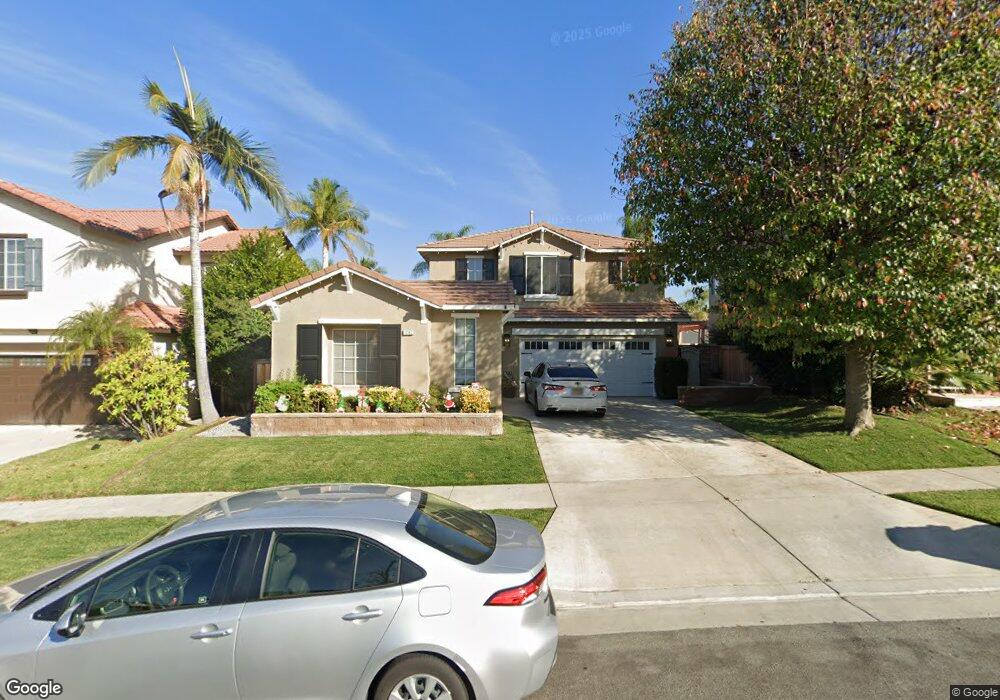
3183 Mountain Pass Dr Unit 73 Corona, CA 92882
South Corona NeighborhoodEstimated Value: $806,159 - $863,000
3
Beds
3
Baths
2,187
Sq Ft
$382/Sq Ft
Est. Value
About This Home
This home is located at 3183 Mountain Pass Dr Unit 73, Corona, CA 92882 and is currently estimated at $835,290, approximately $381 per square foot. 3183 Mountain Pass Dr Unit 73 is a home located in Riverside County with nearby schools including Dwight D. Eisenhower Elementary School, Citrus Hills Intermediate School, and Santiago High School.
Ownership History
Date
Name
Owned For
Owner Type
Purchase Details
Closed on
Jul 27, 2023
Sold by
Hascall Robert C and Hascall Tanya M
Bought by
Robert C Hascall Ii And Tanya M Hascall Revoc and Hascall
Current Estimated Value
Purchase Details
Closed on
Apr 29, 1999
Sold by
Centex Homes
Bought by
Hascall Ii Robert C and Hascall Tanya M
Home Financials for this Owner
Home Financials are based on the most recent Mortgage that was taken out on this home.
Original Mortgage
$186,746
Interest Rate
6.94%
Mortgage Type
Purchase Money Mortgage
Create a Home Valuation Report for This Property
The Home Valuation Report is an in-depth analysis detailing your home's value as well as a comparison with similar homes in the area
Home Values in the Area
Average Home Value in this Area
Purchase History
| Date | Buyer | Sale Price | Title Company |
|---|---|---|---|
| Robert C Hascall Ii And Tanya M Hascall Revoc | -- | None Listed On Document | |
| Hascall Ii Robert C | $197,000 | Fidelity National Title |
Source: Public Records
Mortgage History
| Date | Status | Borrower | Loan Amount |
|---|---|---|---|
| Previous Owner | Hascall Ii Robert C | $186,746 |
Source: Public Records
Tax History
| Year | Tax Paid | Tax Assessment Tax Assessment Total Assessment is a certain percentage of the fair market value that is determined by local assessors to be the total taxable value of land and additions on the property. | Land | Improvement |
|---|---|---|---|---|
| 2025 | $3,981 | $330,205 | $78,370 | $251,835 |
| 2023 | $3,981 | $317,385 | $75,328 | $242,057 |
| 2022 | $4,231 | $311,162 | $73,851 | $237,311 |
| 2021 | $4,161 | $305,061 | $72,403 | $232,658 |
| 2020 | $4,129 | $301,934 | $71,661 | $230,273 |
| 2019 | $4,138 | $296,014 | $70,256 | $225,758 |
| 2018 | $4,402 | $290,211 | $68,880 | $221,331 |
| 2017 | $4,323 | $284,522 | $67,530 | $216,992 |
| 2016 | $4,281 | $278,944 | $66,206 | $212,738 |
| 2015 | $4,212 | $274,756 | $65,212 | $209,544 |
| 2014 | $4,121 | $269,377 | $63,936 | $205,441 |
Source: Public Records
Map
Nearby Homes
- 3231 Hannover St
- 1153 Archer Cir Unit 89
- 3199 Rowena Dr
- 3312 Clearing Ln
- 3052 Drake St
- 833 W Orange Height Ln
- 664 Rembrandt Cir
- 3735 Hilgard St
- 3527 Galatea Way
- 435 Rembrandt Dr
- 2812 Via Mazatlan
- 3933 Malaga St
- 825 Derby St
- 532 W Orange Height Ln
- 2809 Lancaster Ln
- 660 Glen Springs Ln
- 2979 McDonald Ln
- 2527 Waterfall Ln
- 142 Tamarack Dr
- 2501 Water Way
- 3195 Mountain Pass Dr Unit 74
- 3195 Mountain Pass Dr
- 3171 Mountain Pass Dr
- 3207 Mountain Pass Dr Unit 75
- 3180 Windhaven Way
- 3172 Windhaven Way Unit 58
- 3164 Windhaven Way Unit 59
- 3188 Windhaven Way
- 3219 Mountain Pass Dr
- 3220 Mountain Pass Dr
- 3156 Windhaven Way Unit 60
- 3232 Mountain Pass Dr
- 3244 Moutain Pass Dr
- 3244 Mountain Pass Dr
- 3208 Mountain Pass Dr
- 3231 Mountain Pass Dr
- 3196 Mountain Pass Dr
- 3148 Windhaven Way
- 3256 Mountain Pass Dr
- 1047 Bainbridge Cir
Your Personal Tour Guide
Ask me questions while you tour the home.