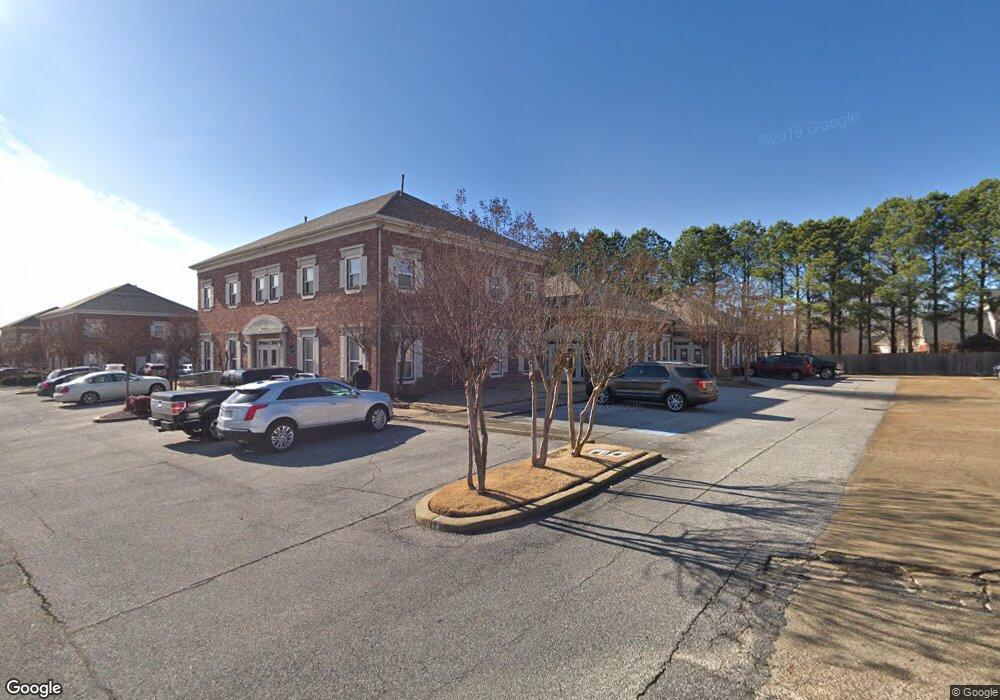
3189 Kirby Whitten Rd Unit 104 Memphis, TN 38134
--
Bed
--
Bath
1,200
Sq Ft
1,220
Sq Ft Lot
About This Home
This home is located at 3189 Kirby Whitten Rd Unit 104, Memphis, TN 38134. 3189 Kirby Whitten Rd Unit 104 is a home located in Shelby County with nearby schools including Altruria Elementary School, Elmore Park Middle School, and Bartlett High School.
Ownership History
Date
Name
Owned For
Owner Type
Purchase Details
Closed on
Sep 24, 2019
Sold by
Cornies Dawn M Clements
Bought by
Cornies Matthew P
Purchase Details
Closed on
Nov 19, 2010
Sold by
Regions Bank
Bought by
Cornies Matthew P and Cornies Dawn M Clement
Home Financials for this Owner
Home Financials are based on the most recent Mortgage that was taken out on this home.
Original Mortgage
$102,000
Interest Rate
4.3%
Mortgage Type
Commercial
Purchase Details
Closed on
May 17, 2010
Sold by
Harris Reginald K
Bought by
Regions Bank
Purchase Details
Closed on
Feb 13, 2007
Sold by
Shelly Deborah and Shelly Timothy
Bought by
Harris Reginald K
Home Financials for this Owner
Home Financials are based on the most recent Mortgage that was taken out on this home.
Original Mortgage
$140,004
Interest Rate
6.17%
Mortgage Type
Commercial
Purchase Details
Closed on
Mar 21, 2005
Sold by
Omalley Carmen S
Bought by
Shelly Deborah
Create a Home Valuation Report for This Property
The Home Valuation Report is an in-depth analysis detailing your home's value as well as a comparison with similar homes in the area
Home Values in the Area
Average Home Value in this Area
Purchase History
| Date | Buyer | Sale Price | Title Company |
|---|---|---|---|
| Cornies Matthew P | -- | None Available | |
| Cornies Matthew P | $120,000 | Mid South Title Services Llc | |
| Regions Bank | $125,693 | None Available | |
| Harris Reginald K | $185,000 | None Available | |
| Shelly Deborah | $7,500 | -- |
Source: Public Records
Mortgage History
| Date | Status | Borrower | Loan Amount |
|---|---|---|---|
| Closed | Cornies Matthew P | $102,000 | |
| Previous Owner | Harris Reginald K | $140,004 |
Source: Public Records
Tax History Compared to Growth
Tax History
| Year | Tax Paid | Tax Assessment Tax Assessment Total Assessment is a certain percentage of the fair market value that is determined by local assessors to be the total taxable value of land and additions on the property. | Land | Improvement |
|---|---|---|---|---|
| 2025 | $1,650 | $58,280 | $12,000 | $46,280 |
| 2024 | $1,650 | $48,680 | $12,000 | $36,680 |
| 2023 | $2,492 | $48,680 | $12,000 | $36,680 |
| 2022 | $2,492 | $48,680 | $12,000 | $36,680 |
| 2021 | $2,531 | $48,680 | $12,000 | $36,680 |
| 2020 | $2,975 | $50,600 | $12,000 | $38,600 |
| 2019 | $2,975 | $50,600 | $12,000 | $38,600 |
| 2018 | $2,975 | $50,600 | $12,000 | $38,600 |
| 2017 | $2,080 | $50,600 | $12,000 | $38,600 |
| 2016 | $2,126 | $48,640 | $0 | $0 |
| 2014 | $2,126 | $48,640 | $0 | $0 |
Source: Public Records
Map
Nearby Homes
- 3148 Hill Lake Dr
- 6635 Star Valley Dr
- 3082 Kirby Whitten Rd
- 6806 Briarfield Ln
- Webster Plan at Union Depot
- Asher Plan at Union Depot
- Glenmore Plan at Union Depot
- Manning Plan at Union Depot
- Lewis Plan at Union Depot
- Emerson Plan at Union Depot
- Chapman Plan at Union Depot
- Hudson Plan at Union Depot
- Kensley Plan at Union Depot
- Amelia Plan at Union Depot
- 6894 Hedgewood Ln
- 6888 Johnstown Ln
- 6897 Johnstown Ln
- 6884 Johnstown Ln
- Terrace Plan at Union Depot - The Townhomes
- Provost Plan at Union Depot - The Townhomes
- 3189 Kirby Whitten Rd
- 3189 Kirby Whitten Rd Unit 106
- 3042 Kirby Lakes Dr
- 0 Kirby Whitten Rd Unit 3206941
- 0 Kirby Whitten Rd Unit 3289022
- 0 Kirby Whitten Rd Unit 9969673
- 3042/2 Kirby Lakes Dr
- 0 Kirby Whitten Rd Unit 10077411
- 3205 Kirby Whitten Rd Unit 102-204
- 3205 Kirby Whitten Rd Unit 104
- 3173 Kirby Whitten Rd Unit 102
- 3173 Kirby Whitten Rd Unit 101
- 3173 Kirby Whitten Rd Unit 105
- 6692 Morning Star Cove
- 6711 Golden Star Cove
- 6705 Golden Star Cove
- 6750 Kirby Lakes Dr
- 6693 Morning Star Cove
- 3177 Valley Lake Dr
- 6747 Kirby Lakes Dr