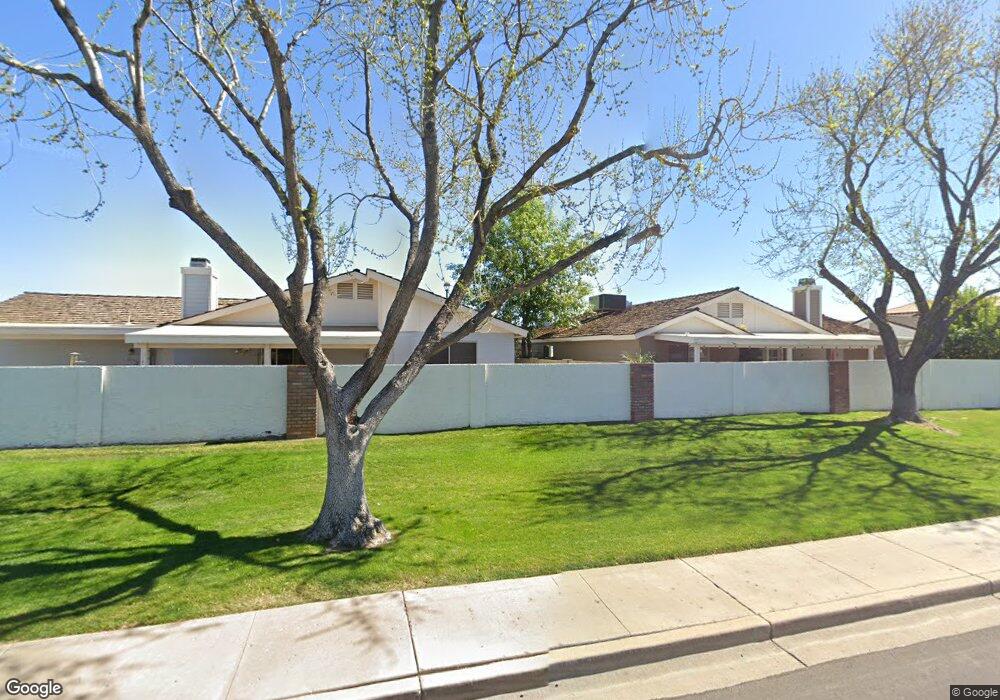
319 E Hartford Ave Phoenix, AZ 85022
North Central Phoenix NeighborhoodEstimated Value: $330,336 - $402,000
--
Bed
2
Baths
1,313
Sq Ft
$288/Sq Ft
Est. Value
About This Home
This home is located at 319 E Hartford Ave, Phoenix, AZ 85022 and is currently estimated at $377,584, approximately $287 per square foot. 319 E Hartford Ave is a home located in Maricopa County with nearby schools including Cactus View Elementary School, Vista Verde Middle School, and Greenway Middle School.
Ownership History
Date
Name
Owned For
Owner Type
Purchase Details
Closed on
Feb 12, 2008
Sold by
Jones Adam
Bought by
Boldini Maria Laura
Current Estimated Value
Purchase Details
Closed on
Dec 13, 2004
Sold by
Barnett Shannon
Bought by
Jones Adam and Jones Joy
Purchase Details
Closed on
Mar 11, 1998
Sold by
Barnett David
Bought by
Barnett Shannon
Home Financials for this Owner
Home Financials are based on the most recent Mortgage that was taken out on this home.
Original Mortgage
$99,350
Interest Rate
7.02%
Mortgage Type
New Conventional
Purchase Details
Closed on
Feb 27, 1998
Sold by
Curtis Steven S
Bought by
Barnett Shannon
Home Financials for this Owner
Home Financials are based on the most recent Mortgage that was taken out on this home.
Original Mortgage
$99,350
Interest Rate
7.02%
Mortgage Type
New Conventional
Purchase Details
Closed on
May 7, 1996
Sold by
Curtis Steven S and Lewis Monica M
Bought by
Curtis Steven S
Create a Home Valuation Report for This Property
The Home Valuation Report is an in-depth analysis detailing your home's value as well as a comparison with similar homes in the area
Home Values in the Area
Average Home Value in this Area
Purchase History
| Date | Buyer | Sale Price | Title Company |
|---|---|---|---|
| Boldini Maria Laura | $209,000 | Equity Title Agency Inc | |
| Jones Adam | $138,000 | Capital Title Agency Inc | |
| Barnett Shannon | -- | Capital Title Agency | |
| Barnett Shannon | $104,600 | Capital Title Agency | |
| Curtis Steven S | -- | -- |
Source: Public Records
Mortgage History
| Date | Status | Borrower | Loan Amount |
|---|---|---|---|
| Previous Owner | Barnett Shannon | $99,350 |
Source: Public Records
Tax History Compared to Growth
Tax History
| Year | Tax Paid | Tax Assessment Tax Assessment Total Assessment is a certain percentage of the fair market value that is determined by local assessors to be the total taxable value of land and additions on the property. | Land | Improvement |
|---|---|---|---|---|
| 2025 | $1,586 | $16,368 | -- | -- |
| 2024 | $1,595 | $15,588 | -- | -- |
| 2023 | $1,595 | $26,700 | $5,340 | $21,360 |
| 2022 | $1,579 | $20,730 | $4,140 | $16,590 |
| 2021 | $1,584 | $19,150 | $3,830 | $15,320 |
| 2020 | $1,535 | $17,830 | $3,560 | $14,270 |
| 2019 | $1,318 | $17,510 | $3,500 | $14,010 |
| 2018 | $1,698 | $16,230 | $3,240 | $12,990 |
| 2017 | $1,213 | $14,310 | $2,860 | $11,450 |
| 2016 | $1,194 | $13,710 | $2,740 | $10,970 |
| 2015 | $1,108 | $12,820 | $2,560 | $10,260 |
Source: Public Records
Map
Nearby Homes
- 2 E Muriel Dr
- 515 E Charleston Ave
- 16818 N Canterbury Dr Unit 56
- 16821 N 1st Ave Unit 53
- 17845 N 6th St
- 16817 N 1st Dr Unit 28
- 815 E Grovers Ave Unit 55
- 815 E Grovers Ave Unit 8
- 16821 N 1st Ln Unit 10
- 714 E Morningside Dr
- 17825 N 7th St Unit 134
- 17825 N 7th St Unit 83
- 18021 N 1st Place
- 748 E Morningside Dr
- 16819 N 2nd Dr Unit 281
- 16614 N 1st Ave Unit 92
- 16822 N 2nd Dr Unit 263
- 16609 N 1st Ave Unit 76
- 239 W Angela Dr
- 16617 N 1st Ln Unit 131
- 325 E Hartford Ave
- 313 E Hartford Ave
- 320 E Danbury Rd
- 326 E Danbury Rd
- 320 E Hartford Ave
- 314 E Danbury Rd
- 320 R E Hartford Ave
- 326 E Hartford Ave
- 314 E Hartford Ave
- 401 E Hartford Ave
- 402 E Danbury Rd
- 402 E Hartford Ave
- 17214 N 3rd Place
- 319 E Anderson Ave
- 17208 N 3rd Place
- 325 E Anderson Ave
- 313 E Anderson Ave
- 17220 N 3rd Place
- 407 E Hartford Ave
- 408 E Danbury Rd