Estimated Value: $151,000 - $216,000
3
Beds
2
Baths
2,243
Sq Ft
$85/Sq Ft
Est. Value
About This Home
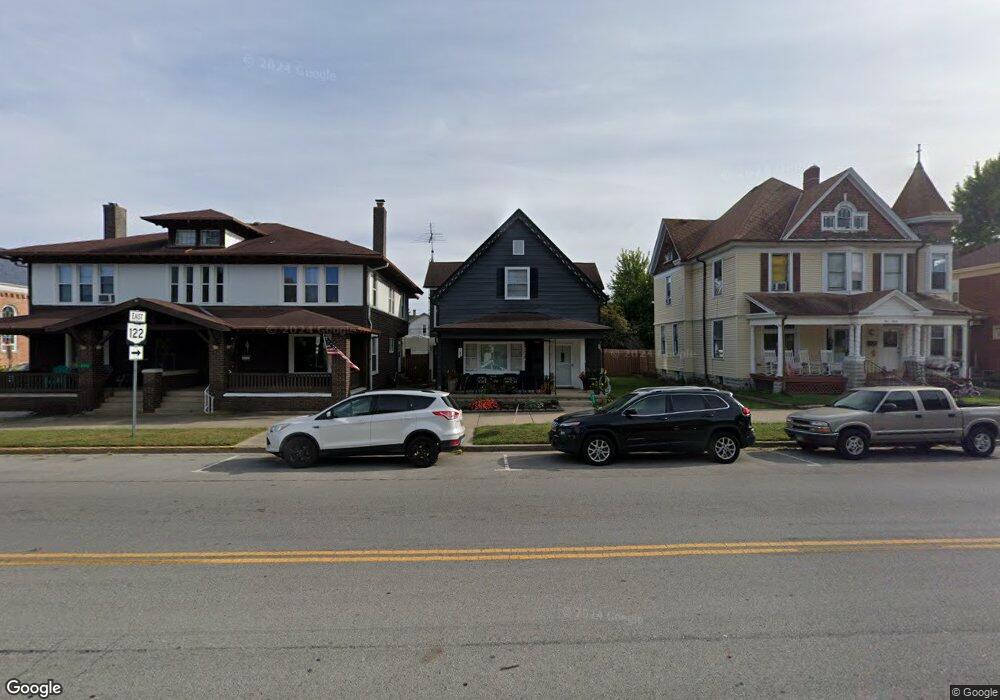
This home is located at 319 E Main St, Eaton, OH 45320 and is currently estimated at $190,073, approximately $84 per square foot. 319 E Main St is a home located in Preble County with nearby schools including Hollingsworth East Elementary School, William Bruce Elementary School, and Eaton Middle School.
Ownership History
Date
Name
Owned For
Owner Type
Purchase Details
Closed on
Oct 5, 2020
Sold by
Wehrly Kevin Eldon and Denlinger Amanda Sue
Bought by
Thrasher Donald L and Mcmeekin Thrasher Sonja
Current Estimated Value
Purchase Details
Closed on
Sep 15, 2020
Sold by
Wehrly Suzanne M
Bought by
Wehrly Henry P and Wehrly Suzannne M
Purchase Details
Closed on
Mar 10, 2014
Sold by
Jpmorgan Chase Bank Na
Bought by
Secretary Of Hud
Purchase Details
Closed on
Apr 2, 2010
Sold by
Wehrly Kevin Eldon and Denlinger Amanda Sue
Bought by
Wehrly Henry P and Wehrly Suzanne M
Purchase Details
Closed on
Apr 1, 2010
Sold by
Wehrly Henry P and Wehrly Suzanne M
Bought by
Wehrly Kevin Eldon and Denlinger Amanda Sue
Purchase Details
Closed on
Nov 2, 1992
Bought by
Denlinger Amanda Sue Wehrly Henry P
Create a Home Valuation Report for This Property
The Home Valuation Report is an in-depth analysis detailing your home's value as well as a comparison with similar homes in the area
Home Values in the Area
Average Home Value in this Area
Purchase History
| Date | Buyer | Sale Price | Title Company |
|---|---|---|---|
| Thrasher Donald L | $65,000 | Performance Title | |
| Wehrly Henry P | -- | None Available | |
| Secretary Of Hud | -- | None Available | |
| Wehrly Henry P | -- | Attorney | |
| Wehrly Kevin Eldon | -- | Attorney | |
| Denlinger Amanda Sue Wehrly Henry P | $106,100 | -- |
Source: Public Records
Tax History
| Year | Tax Paid | Tax Assessment Tax Assessment Total Assessment is a certain percentage of the fair market value that is determined by local assessors to be the total taxable value of land and additions on the property. | Land | Improvement |
|---|---|---|---|---|
| 2024 | $1,910 | $52,920 | $9,870 | $43,050 |
| 2023 | $1,888 | $52,920 | $9,870 | $43,050 |
| 2022 | $1,531 | $35,000 | $9,170 | $25,830 |
| 2021 | $1,607 | $35,000 | $9,170 | $25,830 |
| 2020 | $1,694 | $35,000 | $9,170 | $25,830 |
| 2019 | $1,552 | $34,480 | $7,770 | $26,710 |
| 2018 | $1,601 | $34,480 | $7,770 | $26,710 |
| 2017 | $1,501 | $34,480 | $7,770 | $26,710 |
| 2016 | $1,391 | $32,170 | $7,770 | $24,400 |
| 2014 | $1,368 | $32,170 | $7,770 | $24,400 |
| 2013 | $1,413 | $32,165 | $7,770 | $24,395 |
Source: Public Records
Map
Nearby Homes
- 117 Vine St
- 216 S Franklin St
- 216 Vine St
- 315 S Maple St
- 113 S Barron St
- 300 Aukerman St
- 224 N Barron St
- 115 E Decatur St
- 705 E Decatur St
- 0-00 Washington Jackson Rd
- 130 E High St
- 510 S Maple St
- 210 Mccabe St
- 331 E Monfort St
- 614 Lincoln St
- 124 Deem St
- 415 East Ave
- 900 N Maple St
- 709 N Barron St Unit 711
- 832 S Maple St
- 321 E Main St
- 323 E Main St
- 315 E Main St
- 309 E Main St
- 309 E Main St
- 107 S Franklin St
- 305 E Main St
- 326 E Main St
- 119 S Franklin St
- 310 E Main St Unit 310
- 102 S Maple St
- 104 S Maple St
- 114 S Maple St
- 318 E Main St
- 320 E Main St
- 324 E Main St
- 314 E Main St
- 123 S Franklin St
- 310 E Main St
- 304 E Main St
Your Personal Tour Guide
Ask me questions while you tour the home.